
DENTON COUNTY PEDIATRIC COVID TRENDS
DENTON COUNTY PEDIATRIC COVID TRENDS
Continued lack of mask mandates in the schools place our children in danger on a large scale.

Here's today's graphs on pediatric COVID trends in Denton County based on today's numbers released by Denton County Public Health.
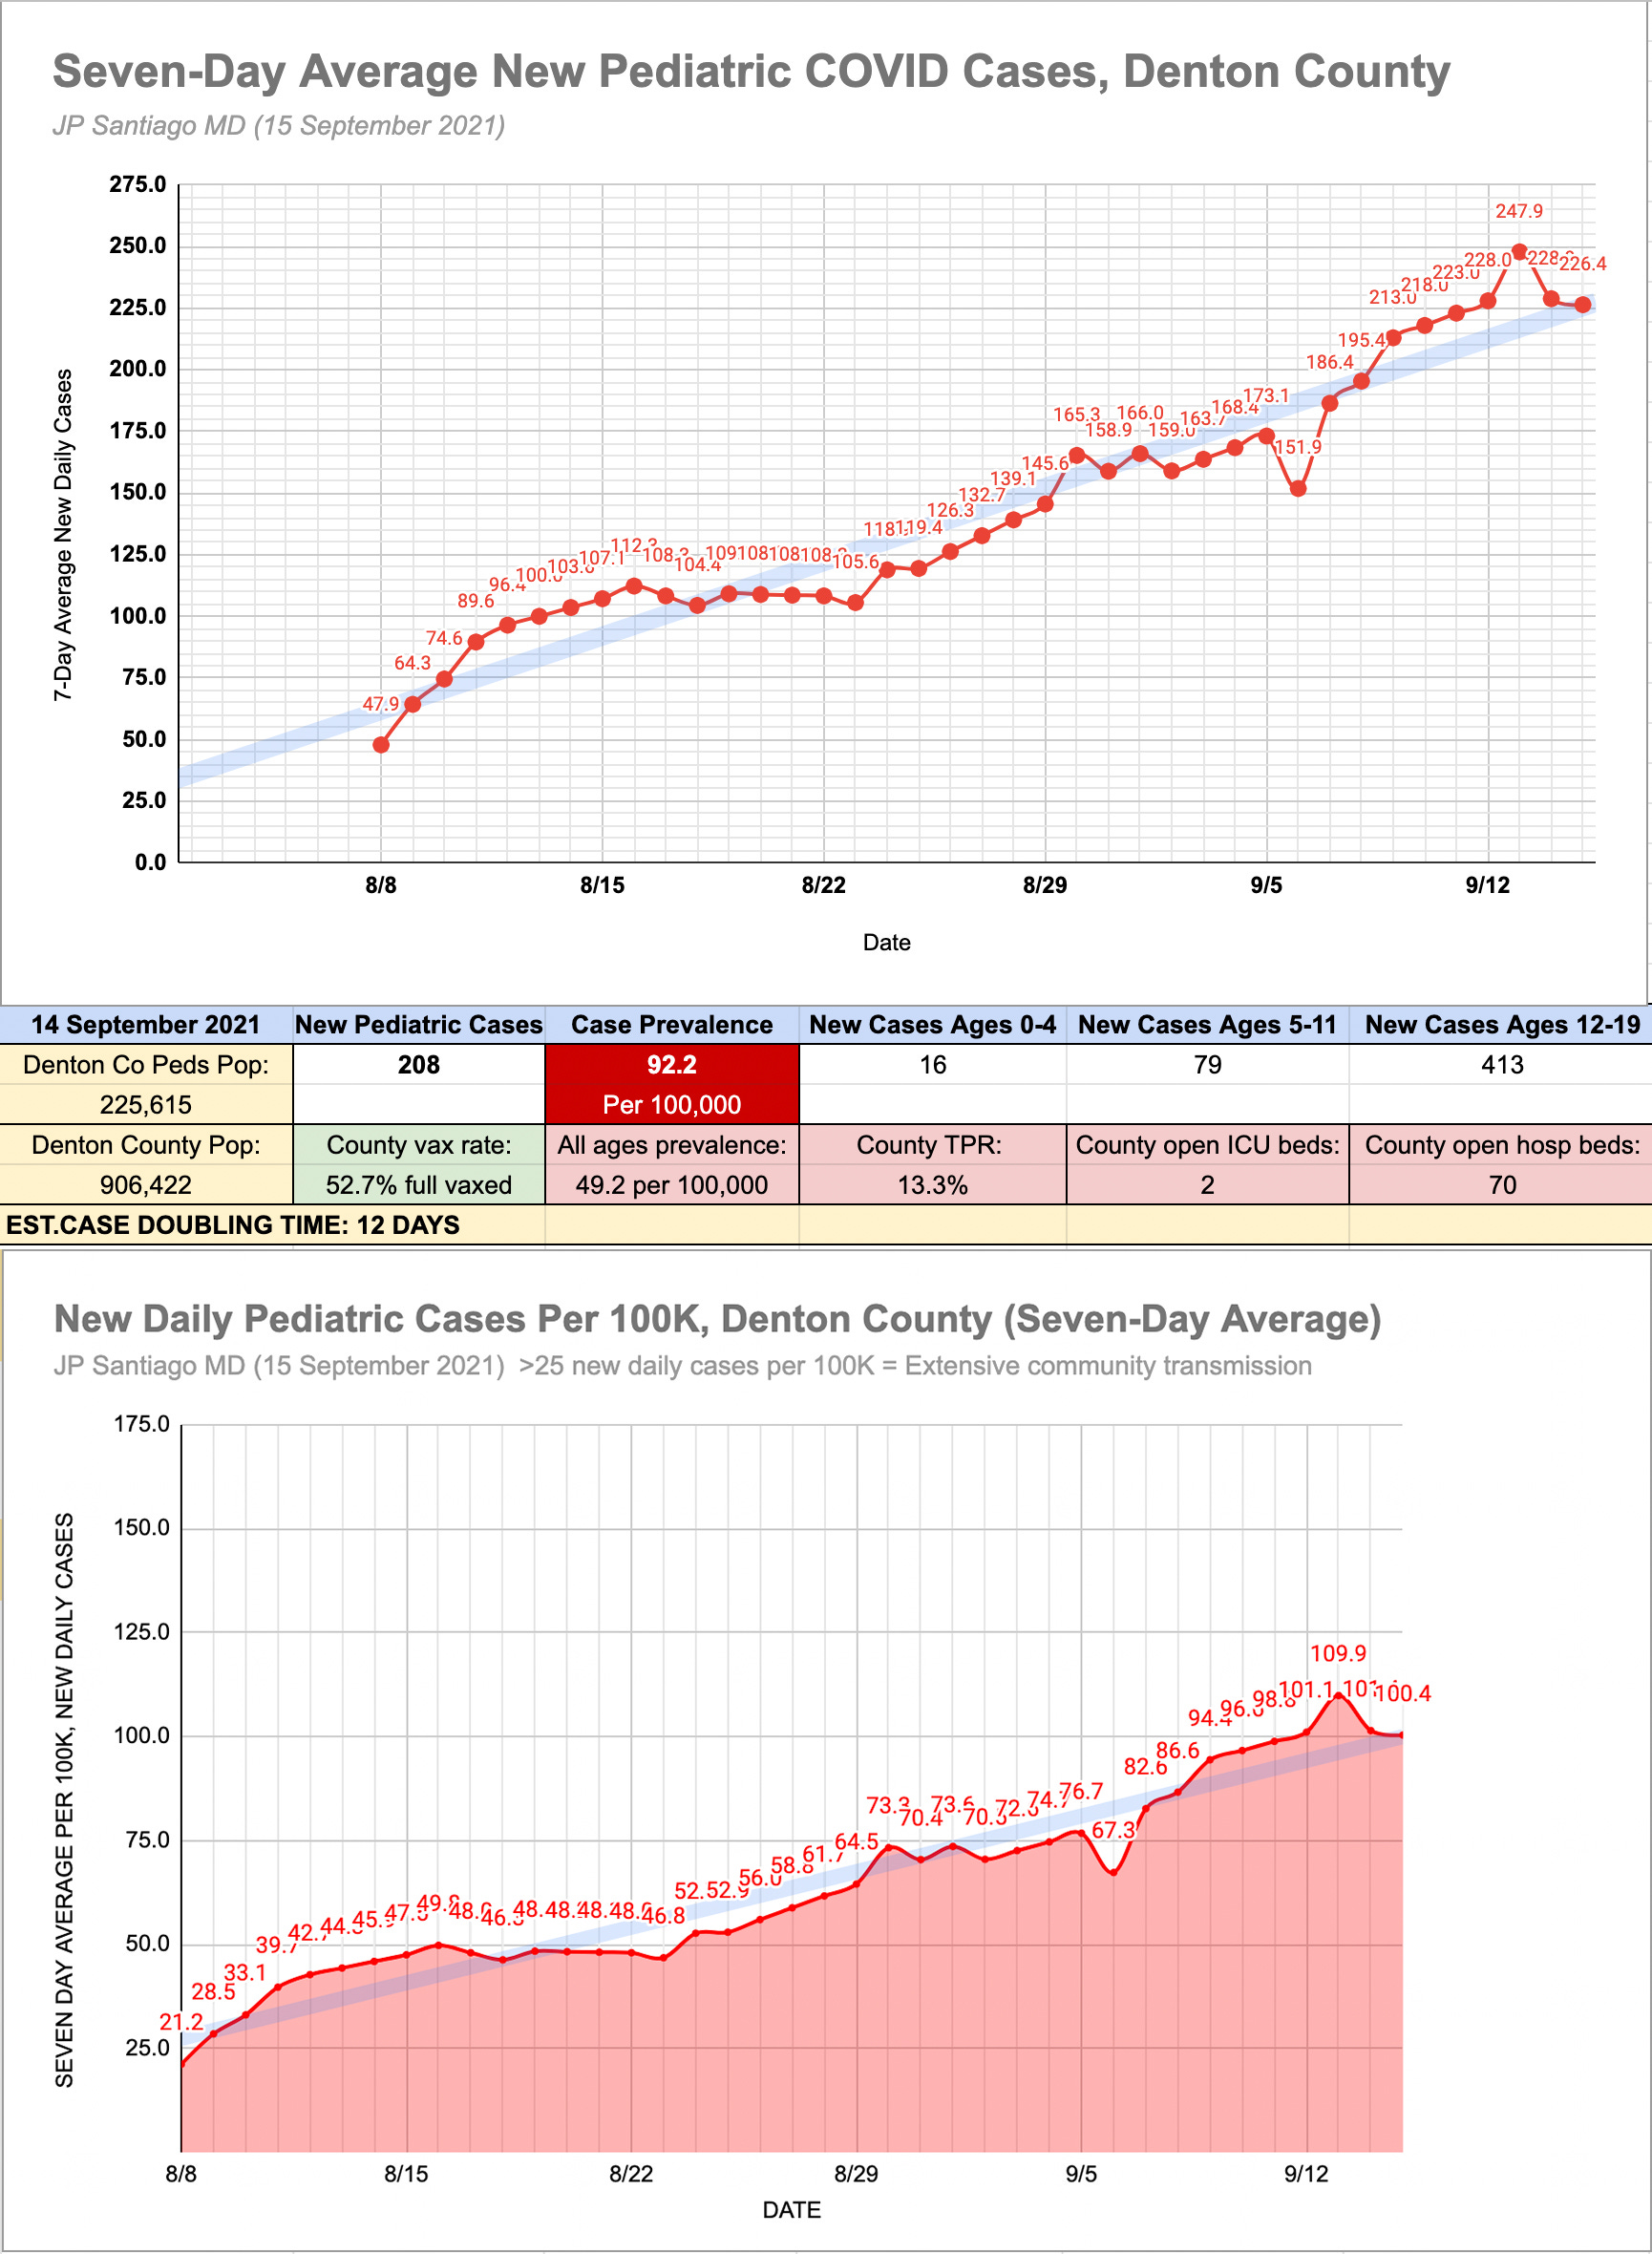
The top graph is a seven day rolling average of the number of new pediatric cases each day in the county.
The blue line is the overall trend, cases are doubling roughly every 11-12 days.
In the box below the top graph are some of today's stats:
208 new pediatric COVID cases (positives in patients ages 0-19).
If we were to consider the pediatric population of Denton County as its own community, it would have just over 225,000 people.
Using that number, the case prevalence is 92.2 per 100,000 people.
For the whole county across all ages, it's 49.2 new cases per 100,000 people.
Per 100K people is a standard expression that normalizes for different population sizes and gives a better idea of pandemic burden than absolute new case numbers.
You can see that the pediatric population of Denton County is shouldering about twice the pandemic burden compared to everyone in the county across all ages.
UT Houston School of Public Health considered new daily cases of 25 or more per 100,000 as highly indicative of extensive community transmission of the virus.
The current fully vaccinated fraction of the Denton County population is 52.7%. That's just a little over 477,000 people.
Biggest pediatric case numbers are in the 12-19 age group.
As of 500pm this afternoon, there were 2 open ICU beds in Denton County and 70 open hospital beds. Critical care and hospitalization resources continue to be under significant strain.
The current test positive rate is 13.3% for the county. This isn't good.
The daily test positive rate doesn’t hinge on the number of tests done. While it is not an independent or durable data trend like hospitalizations or percent physician visits for COVID symptoms, it’s a very useful parameter to gauge pace of pandemic spread in a given population.
If testing is increasing and the pandemic in a given area is slowing down or easing, the test positive rate will drop. More tests, less people sick, lower test positive rate. This is the most ideal situation right now to be in. Anyplace with a daily positive rate under 5% is in good shape in terms of extent of community spread.
If testing is increasing and the pandemic in a community is spreading at a rate that matches testing rates, then the test positive rate levels out. More testing is equal to more cases, so the test positive rate stays the same.
If testing is increasing and the pandemic in the community is spreading at a rate faster than the increase in testing, then the positive rate increases. The benchmark is 10%- with a daily positive rate of 10% or less, you are *likely* to catch most of your COVID cases. 10% is not ideal- usually at 5% or less, we can be sure that not only are we catching all the COVID cases but we’re also testing their close contacts.
At a daily positive rate of 10% or higher, extensive community spread is taking place and the pandemic is overwhelming the testing infrastructure. Denton County has been consistently over 10% since July 23rd.
With prevalence rates not just in kids but across all ages much greater than 25 cases per 100,000 and test positive rates that have been above 10% since the end of July, the lack of a mask mandate in the school districts of the county is absolutely putting children in danger on a large scale.
It's only a matter of time before we see an adverse outcome in either a student or teacher.