
DENTON COUNTY PEDIATRIC COVID UPDATE, JANUARY 7

End of week update on the trends on pediatric COVID cases in Denton County- again, this is data that is released every weekday by Denton County Public Health.
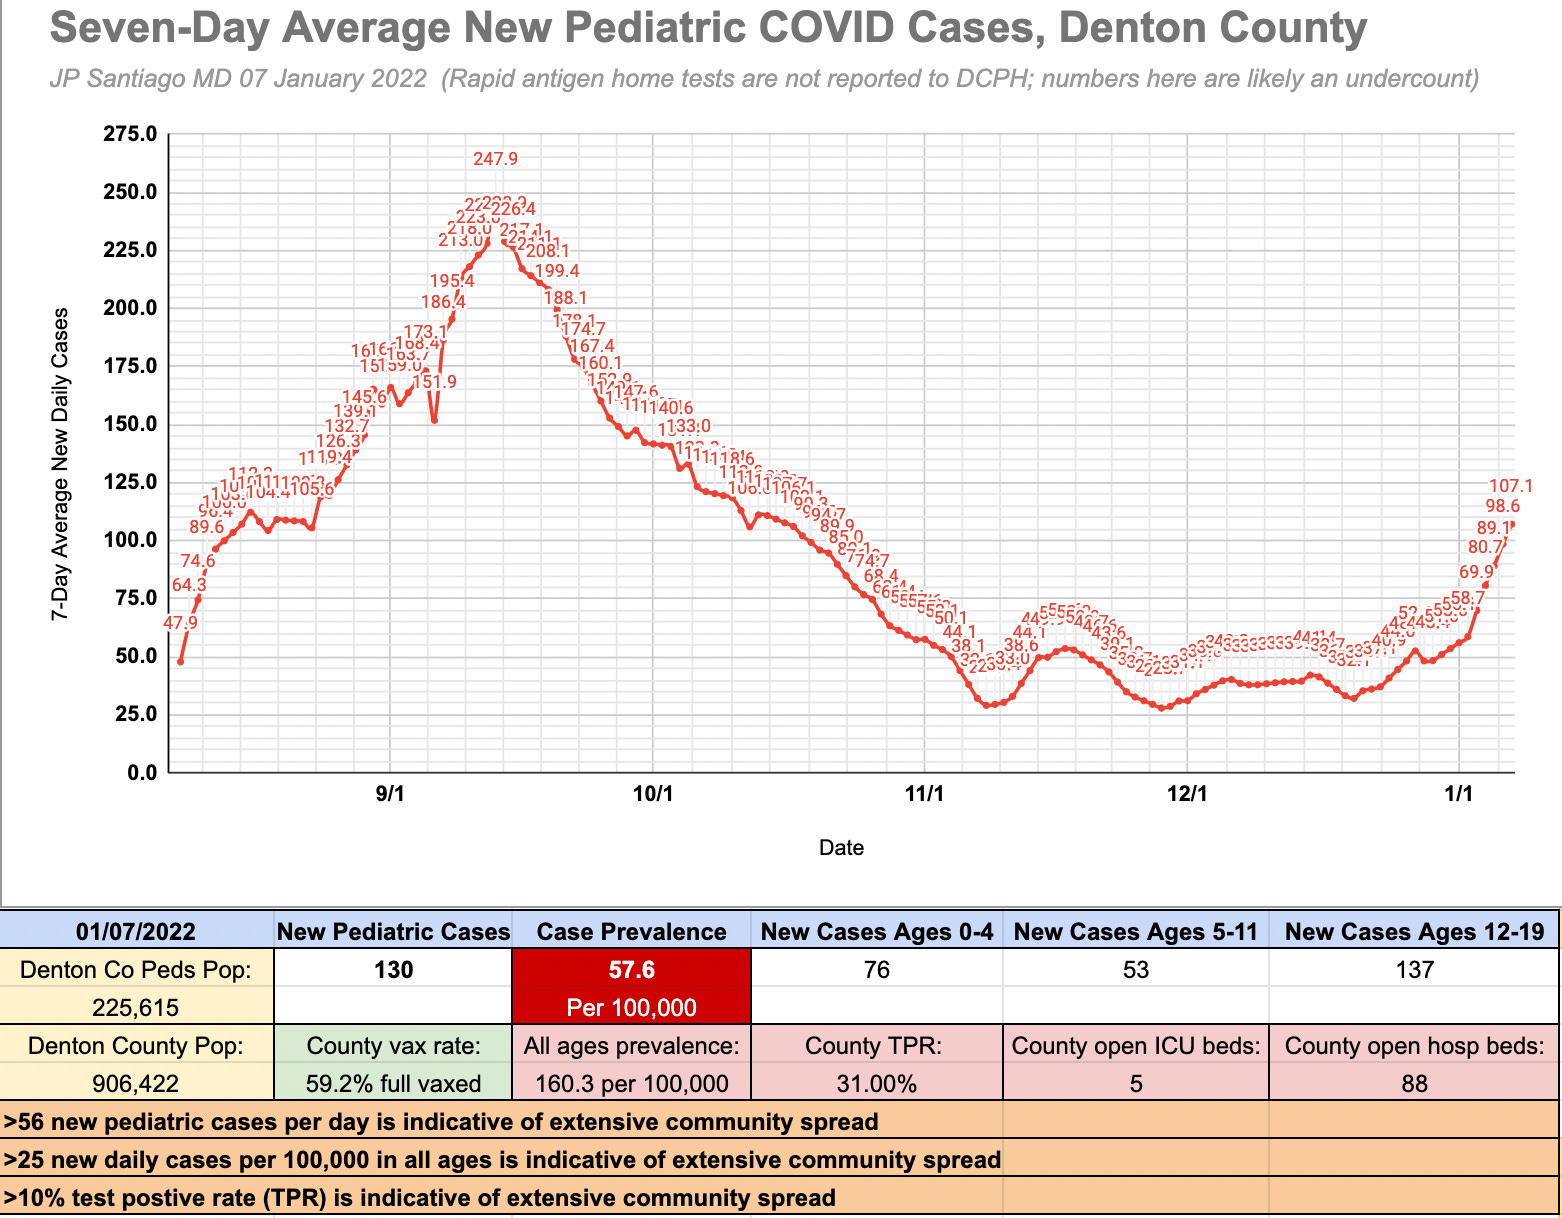
The first graph shows the seven day average of new pediatric COVID cases in our county. We have been on a consistent increase since the week between Christmas and New Years when school was NOT in session. The school districts started this past Thursday, but you can see that the upward slope increased BEFORE school started.
Keep in mind the pandemic environmental parameters in the orange boxes at the bottom of this graph:
>56 new pediatric cases in Denton County each day is indicative of extensive community spread of Omicron. Friday’s data was 130 new cases in those under 19 with a current seven-day average of 107.1.
>25 new daily cases per 100,000 across all ages in Denton County is indicative of extensive, unchecked community spread of Omicron. Yesterday it was 160.3 per 100K, a number that is well over double our previous high water mark on 12/18/20 during last year’s Alpha surge (70.2 per 100,000).
>10% test positive rate (TPR) is also indicative of unchecked community spread of Omicron. A TPR over 10% means inadequate testing is being done to catch all those infected and check their close contacts. Yesterday’s TPR for Denton County was 31%. Our prior high water mark was during last year’s Alpha surge when it was 20.1%.
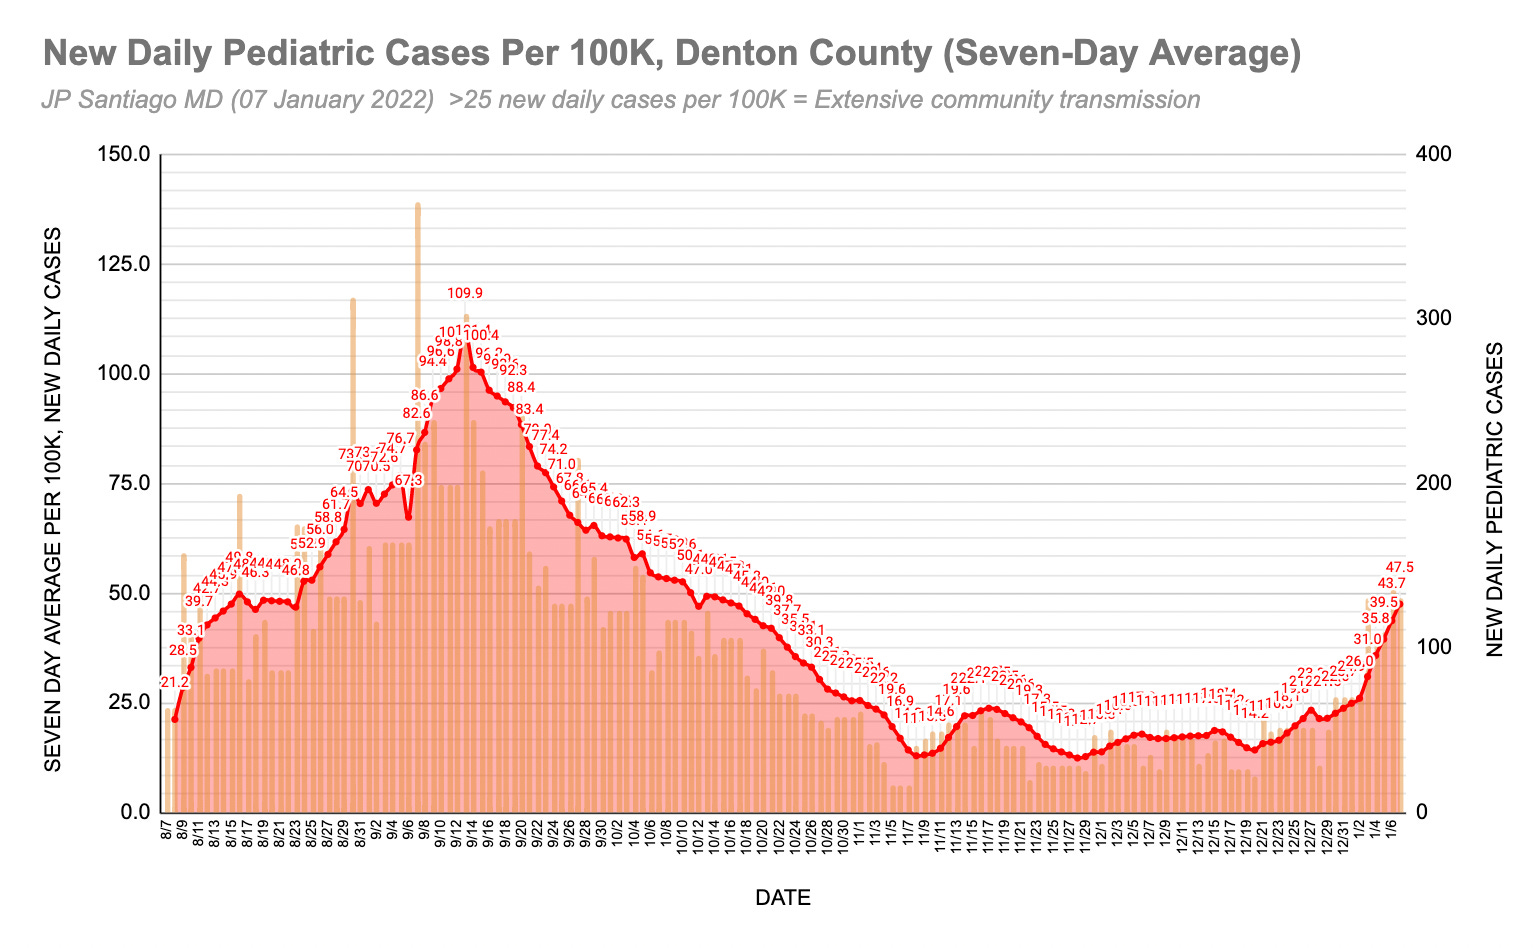
Second graph is the same data but presented in new daily pediatric cases in the county per 100,000 using the pediatric population of Denton County as the cohort. Again, the increase accelerated BEFORE the start of school.
The >25 new daily cases per 100K benchmark also applies here. Vertical bars are each day’s reporting of new cases.
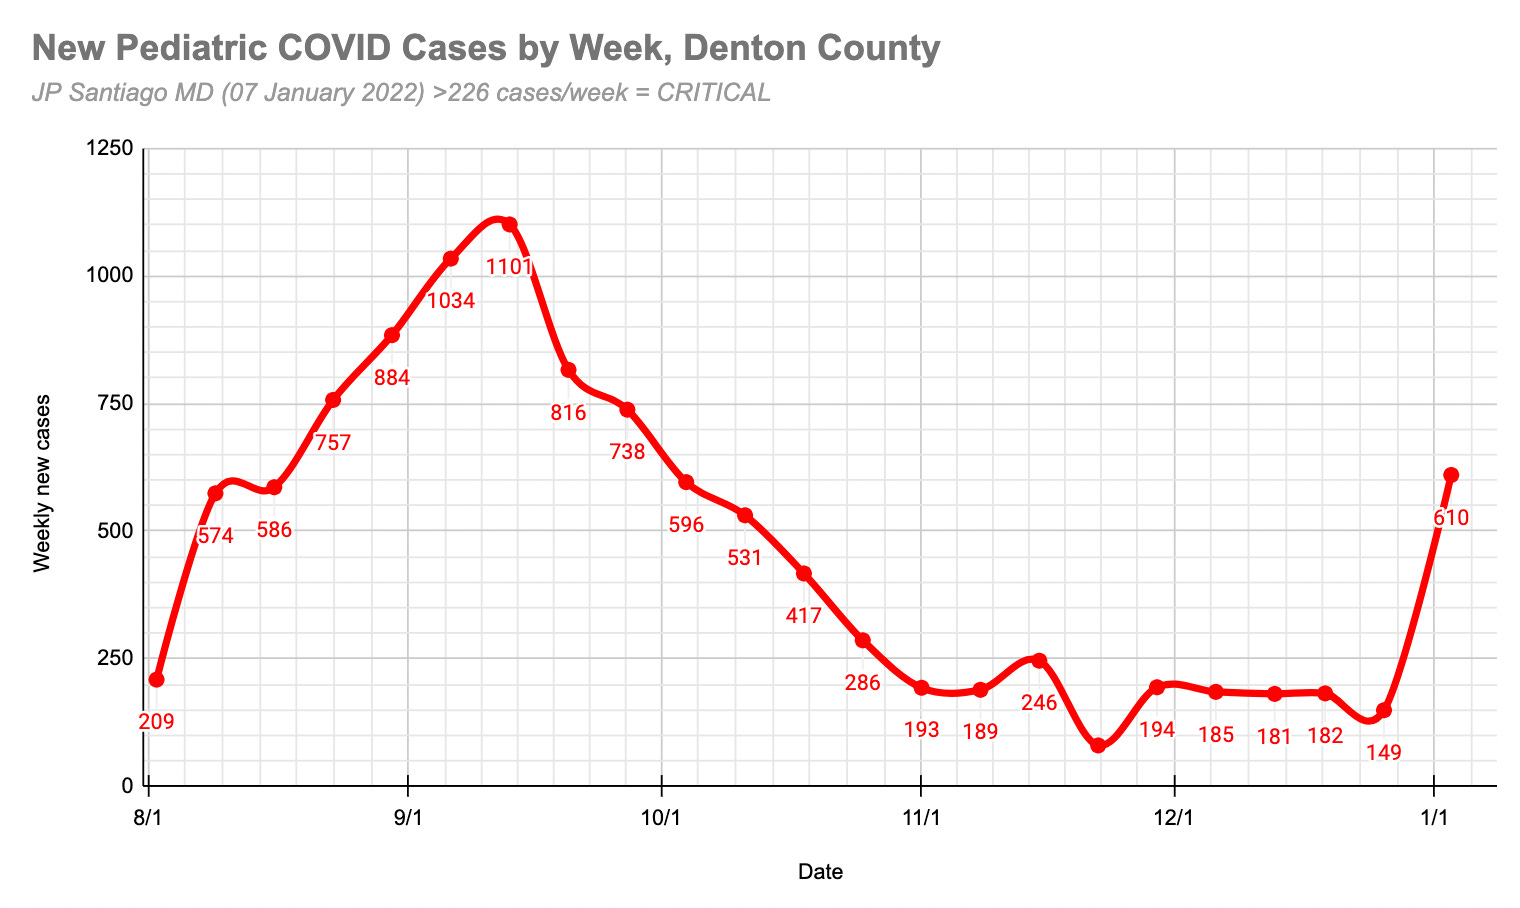
Third graph is the cumulative pediatric COVID cases per week. For the population of Denton County, more than 226 new pediatric cases per week is critical as that would be indicative of unchecked community spread of COVID, in this case the Omicron variant. Things were going reasonably well from November 1 into the holidays but this past week with school only in session for TWO DAYS of the five weekdays, you can see that there has been significant deterioration in the pandemic environment with 610 new cases for the week with the kids not in school for the first three days of that week.
CASE NUMBERS ARE AN UNDER COUNT
There at least four reasons case numbers are an under-count of the true extent of Omicron in the community:
1/ It has been challenging to get an appointment somewhere to get tested as slots are getting filled up by those with symptoms or those who have been exposed. The high test positive rate is an indicator that we are not doing enough testing.
2/ Positive results from home rapid antigen test kits are not reported to the public health authorities. The increased use of home test kits is important and necessary in this pandemic, but keep in mind that those results are not reported as a general rule.
3/ Vaccinated positive people are more likely to have asymptomatic to mild infections and may not consider testing or they may not even have symptoms to suggest to them they should get tested.
4/ All COVID tests, whether PCR, point of care rapid testing in a clinic, or a home rapid antigen test, have false positive rates. No test is fool proof. PCR is the current gold standard and you won't get a result that same day, but even it can be false negative. POCTs (point of care tests) that use nucleic acid amplification like Abbott IDNow or the Cepheid, have a slightly higher false negative rate and then rapid antigen tests like BinaxNOW or QuickVue have an even higher false negative rate. Be aware that the false negative rates can run from 10-15% to as high as 30%.
NOT ALL POSITIVES ARE EQUAL
There's a world of difference clinically between a vaccinated positive and an unvaccinated positive. Hospital systems across the United States in this Omicron surge are seeing far more unvaccinated in their hospitals and ICUs, not unlike our experience with the recent Delta surge. While it is possible for a vaccinated positive to get quite sick, the odds of that are far less.
Most jurisdictions are not breaking out the data to differentiate cases who are vaccinated versus the cases who are unvaccinated, though with more detailed data analysis we can get good estimates of what to expect.
Hospitalizations for COVID are going to be a much more reliable indicator of the pandemic environment as that represents people who are infected and sick enough to require more significant levels of care than home recuperation can provide.
WHERE IS THE ABSENCE DATA FROM THE SCHOOL DISTRICT?
Denton County Public Health was also reporting school absence data last semester and this was very useful as we could get good estimates of the pediatric COVID burden in the community, but the largest school district in Denton County and my home district, Lewisville ISD, has not been reporting absence data and cumulative case data to the DCPH where it can be viewed by the public in a transparent manner. As a parent and physician, this is unacceptable and urge you to contact the school district and school board and let know your displeasure at this lack of transparency.
IS OMICRON MILDER? YES, I'M REPEATING MYSELF. BUT THIS IS IMPORTANT!
We cannot say with certainty despite what news reports are saying. The good quality data we have from various locations that have been enduring the Omicron surge are aggregated to include both vaccinated and unvaccinated patients. Hospitalizations and disease courses may be milder simply because more people are vaccinated now than when Delta emerged in the late summer.
The only way we can say with certainty that Omicron is milder is if we were to compare a cohort of unvaccinated hospitalized patients infected with Delta with a similar cohort of unvaccinated hospitalized patients infected with Omicron. We don't have that data yet.
Even if Omicron were milder (and that is a big IF), its much more contagious than Delta. Let's say for discussion purposes that Delta infects 2 people for every infected and 5% are hospitalized with serious disease. Now let's say (again for discussion to keep the math simple) Omicron only lands 2% of people in the hospital but infects 8 people for every infected person.
If we have 100 people with our hypothetical Delta example, 5 are hospitalized. After one cycle, we now have 300 people infected, another 5% of the 200 newly infected land in the hospital, that's 10 additional people in the hospital for a total of 15. If we go a second cycle, those 300 infect another 600, 5% of them is 30 so now we have 45 in the hospital after two cycles.
If we have 100 people with our hypothetical Omicron example, 2 are hospitalized. After one cycle we now have 900 people infected, another 2% of the 800 is an additional 16 in the hospital for a total of 18. If we go a second cycle, those 800 infect another 6400. 2% of that 6400 is 128, now we have 146 in the hospital after two cycles.
A milder variant that's more contagious is a greater threat to the health care system.
But again, we don't have good statistical data that says Omicron is milder because the data that suggests that includes those who are vaccinated.
We can't say with statistical certainty that Omicron is milder. We can say it is no more severe than Delta. And we can say it is more contagious than Delta. Data was just released this week and published that children who get COVID have a 2.5 times higher risk of developing diabetes. The host receptor that the virus uses, the ACE2 receptor, is not only found in the lungs but it is also found in the pancreas where our insulin-producing cells are located. In my own experience as a family medicine physician, I have seen quite a few patients whose diabetes has become harder to manage since they got COVID. The new data on kids and diabetes risk is of no surprise to me.
PARTING THOUGHTS
America is taking an open book test. And we have even been given the answer key. But many of us are refusing to open the book that has the answers let alone look at the answer key we have been encouraged to use.
That in itself is more demoralizing than the pandemic itself.