
PEDIATRIC COVID CASES: DENTON COUNTY
PEDIATRIC COVID CASES: DENTON COUNTY
The shuffling of the deck chairs on the Titanic continues.

"It's still a mystery of me that people reject masking and at least some semblance of distancing in order to carry out what we all agree is very important aspect of kids being in school in person if possible. But there are safe ways to do it and unsafe ways to do it."
-Gregory Poland, MD, Director of Mayo Clinic's Vaccine Research Group
High resolution version of today's graphic:
https://drive.google.com/file/d/1UZT88rQKWztQYD6VXqgHfglkZiY98RIQ/view?usp=sharing
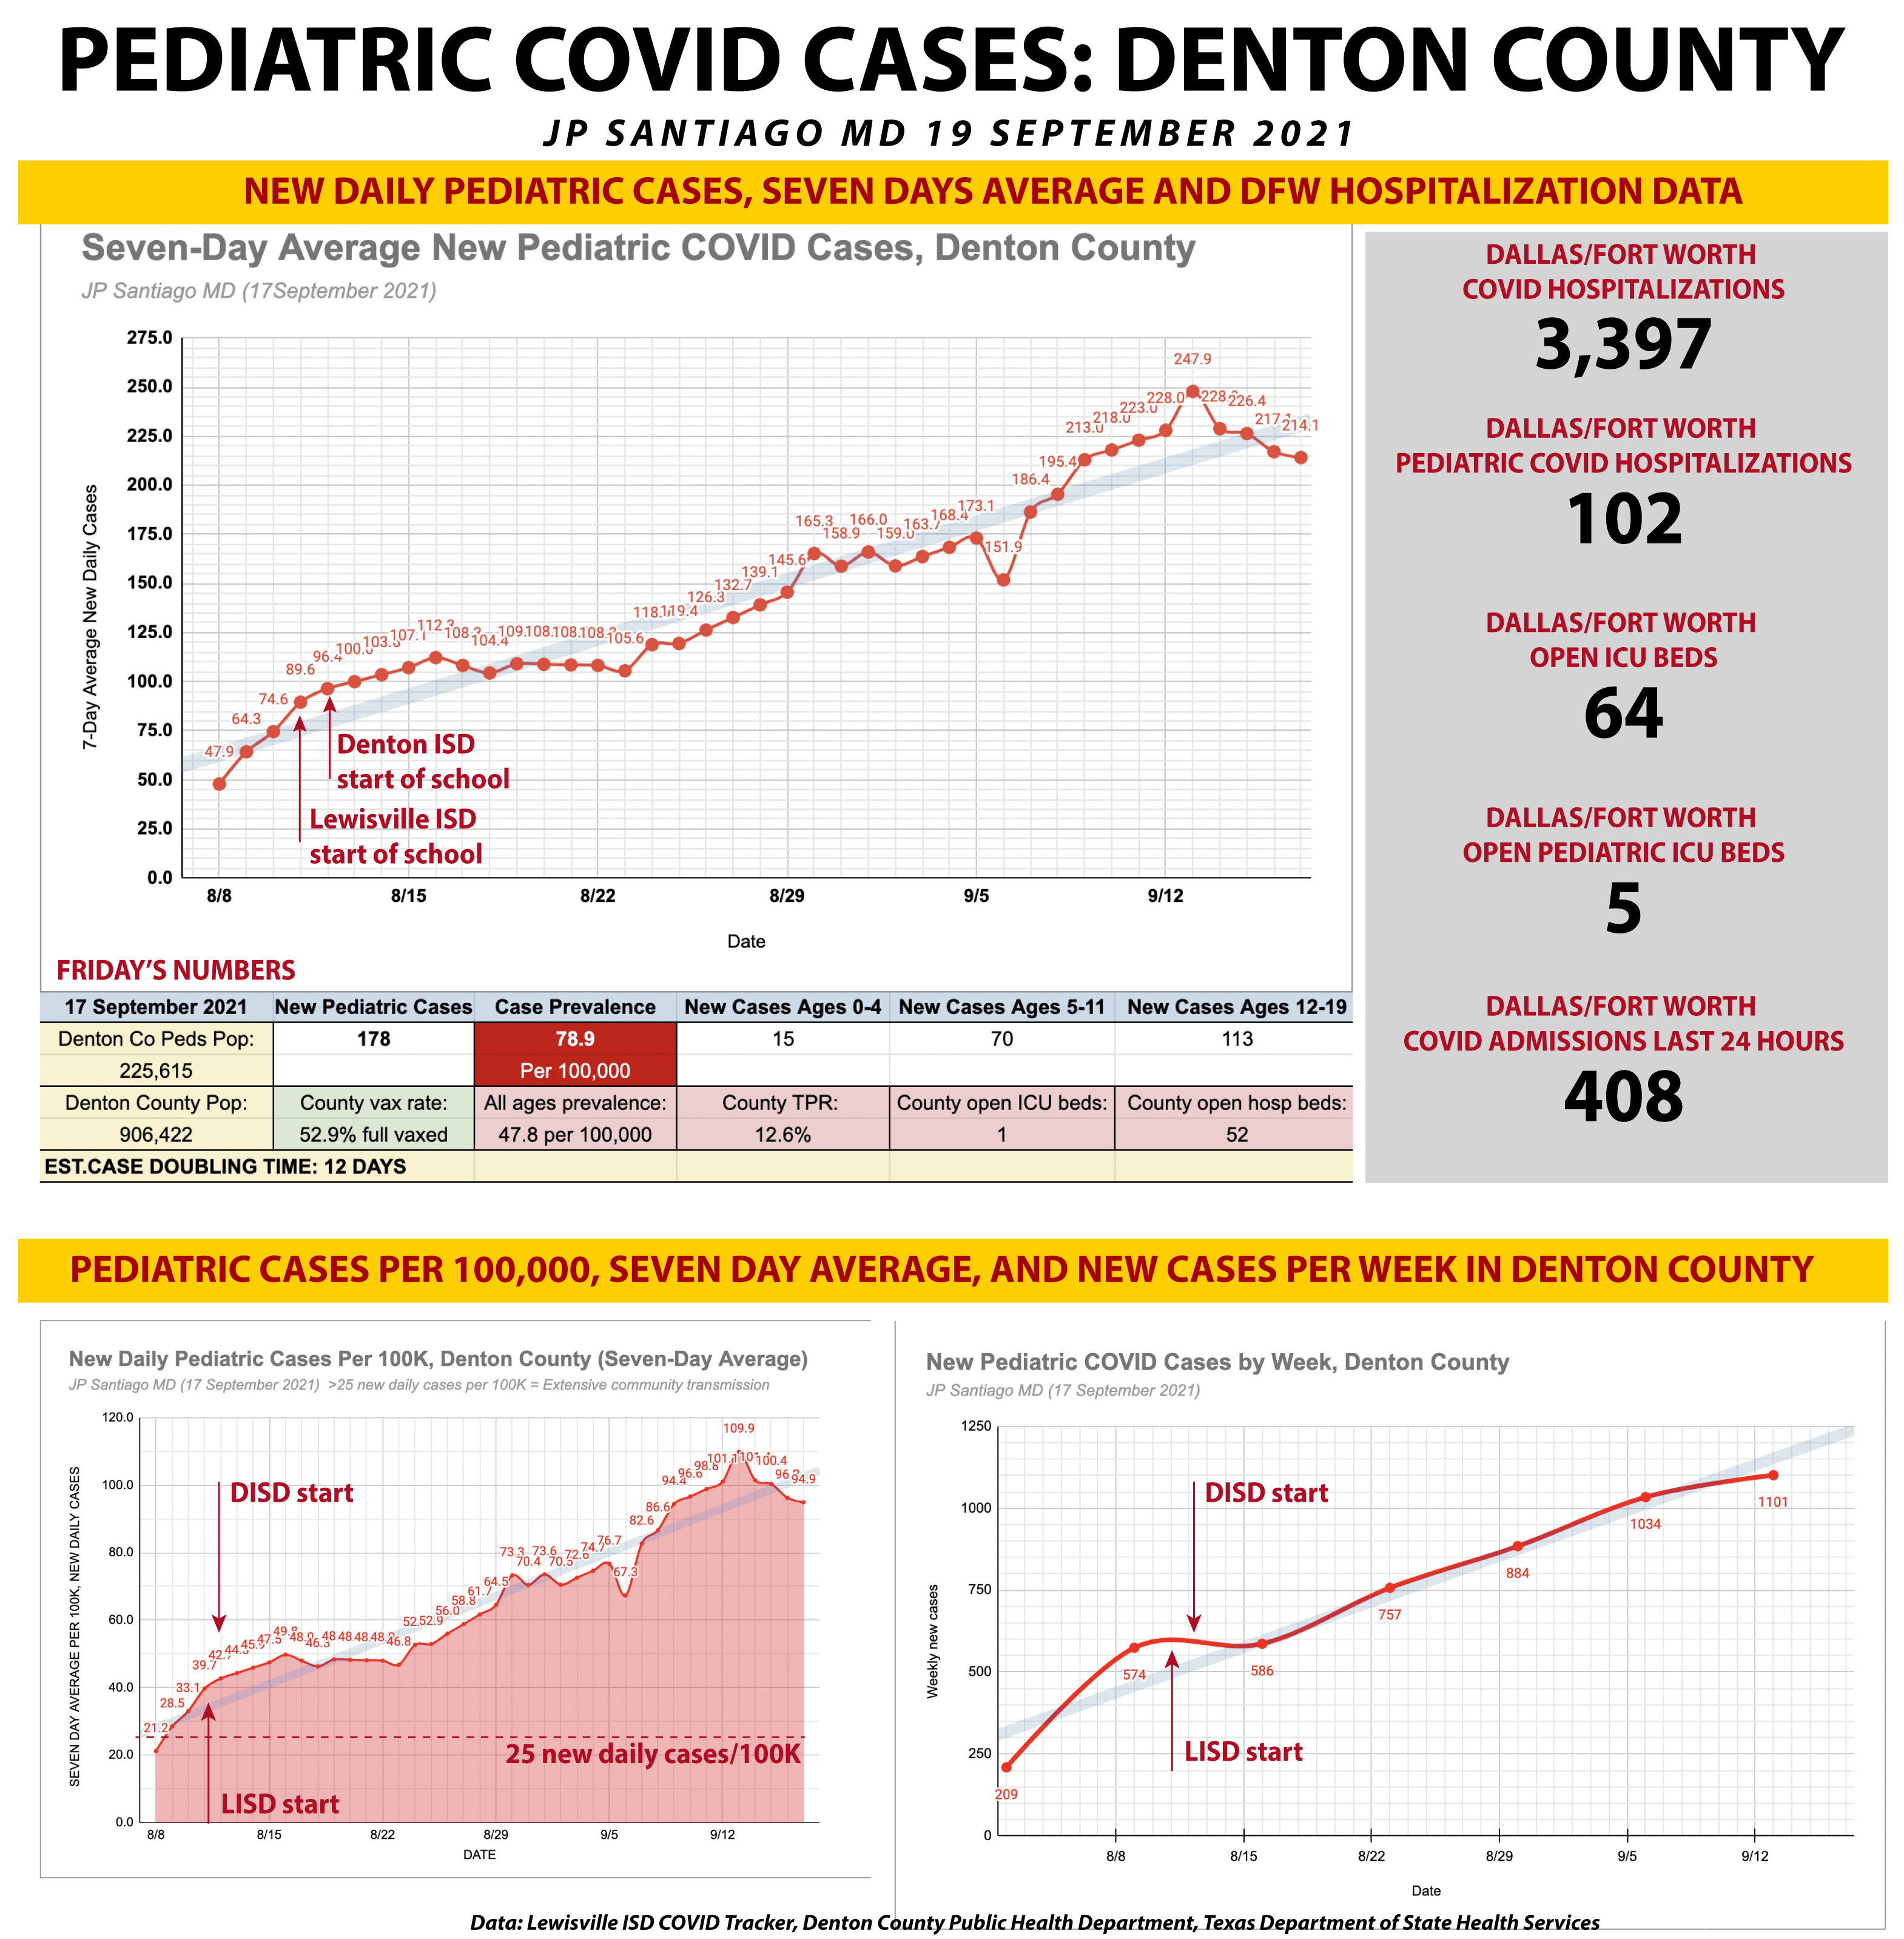
BACKGROUND
Since the start of school (August 11 for Lewisville ISD and August 12 for Denton ISD, the two biggest school districts of Denton County), the number of pediatric cases in the county has been continuously climbing. By and large the districts of the county have not enacted mask mandates to help limit the spread of the highly contagious Delta variant of the SARS-CoV-2 virus.
In the last four weeks, both pediatric and adult hospital and critical care resources have been under progressive strain. Even larger hospitals in North Texas are now facing shortages of key supplies to manage the most ill of COVID patients.
DATA SOURCES
I have been tracking the COVID cases in ages 0-19 in Denton County since the end of July and the three graphs on today's graphic come from data released by Denton County Public Health each weekday. In addition, I have pulled overall DFW area (Trauma Service Area E) hospitalization data from the Texas Department of State Health Services.
The data on the graphs is not specific to any particular school district but represents all pediatric cases in Denton County.
NEW DAILY PEDIATRIC CASES, SEVEN DAY ROLLING AVERAGE
For this graph, I have plotted a seven day rolling average of the numbers of new daily pediatric COVID cases in the county. I have also marked out where school has started. You can see that rolling average of the numbers of new daily cases in kids has essentially quadrupled since August 8.
The last four weekdays there has been a downward trend that I'm very VERY cautiously optimistic about but will have to see how the coming week transpires to know if were on any sort of back slope of a surge in pediatric cases.
FRIDAY'S NUMBERS
I think this section is self explanatory.
If we were to consider the pediatric population of Denton County as its own community, it would have just over 225,000 people. Using that number, the case prevalence on Friday is 78.9 per 100,000 people.
For the whole county across all ages, it's 47.8 new cases per 100,000 people.
Per 100K people is a standard expression that normalizes for different population sizes and gives a better idea of pandemic burden than absolute new case numbers.
You can see that the pediatric population of Denton County is shouldering about twice the pandemic burden compared to everyone in the county across all ages.
UT Houston School of Public Health considers new daily cases of 25 or more per 100,000 as highly indicative of extensive community transmission of the virus.
County test positive rates remain over 10%. To review:
The daily test positive rate doesn’t hinge on the number of tests done. While it is not an independent or durable data trend like hospitalizations or percent physician visits for COVID symptoms, it’s a very useful parameter to gauge pace of pandemic spread in a given population.
If testing is increasing and the pandemic in a given area is slowing down or easing, the test positive rate will drop. More tests, less people sick, lower test positive rate. This is the most ideal situation right now to be in. Anyplace with a daily positive rate under 5% is in good shape in terms of extent of community spread.
If testing is increasing and the pandemic in the community is spreading at a rate faster than the increase in testing, then the positive rate increases. The benchmark is 10%- with a daily positive rate of 10% or less, you are *likely* to catch most of your COVID cases. 10% is not ideal- usually at 5% or less, we can be sure that not only are we catching all the COVID cases but we’re also testing their close contacts.
At a daily positive rate of 10% or higher, extensive community spread is taking place and the pandemic is overwhelming the testing infrastructure. Denton County has been consistently over 10% since July 23rd.
DFW AREA HOSPITALIZATION UTILIZATION
The numbers on the right side of the top of half of today's graphic are from this morning. The hospitalizations for COVID in the DFW area may have peaked last weekend, but it's too early to know for sure. The coming week should be illuminating on the direction things are headed.
Austin, Abilene, College Station, Corpus Christi and Galveston no longer have any ICU margins to spare. Many hospitals that do have capacity are holding what is left for local patients and potential non-COVID needs.
In the DFW area, we only have 3% of our ICU margin left. 40% of ICU patients in North Texas are COVID patients and the vast majority are unvaccinated.
If we have a mass casualty event, if you have a car accident with major trauma, or a heart attack or stroke requiring ICU care, not just in Texas but across the nation, resources are limited to deal with those types of medical emergencies because so much emergency room, hospital, and ICU capacity is taken up by COVID patients.....the vast majority of which are unvaccinated.
PEDIATRIC CASES PER 100,000
The graph in the lower left is the same dataset as the upper graph, only this time I have calculated out the per 100K rate in the pediatric population of Denton County. I have noted where school has started for the two biggest ISDs in the district and the dashed horizontal line marks the 25 new daily cases per 100,000 line. Anything above this line is highly concerning and represents unmitigated spread among the population in question- in this case, the children of Denton County up to the age of 19.
NEW WEEKLY CASES IN DENTON COUNTY
The graph on the lower right is a different look at the same data, this time I've plotted out the new cases per week. It's pretty clear things are still increasing. There is some possible indication that things are slowing, but again, it's too early to say for sure.
TAKE HOME MESSAGES
1/ We have been at greater than 25 new daily cases per 100,000 in the county since August 9 in BOTH the pediatric population and across ALL ages in Denton County.
2/ Current test positive rates in the county show extensive community spread is taking place and the pandemic is overwhelming the testing infrastructure. Denton County has been consistently over 10% since July 23rd.
3/ Think about that for a second. BEFORE school even started, the accepted measures we use in medicine to assess the pandemic environment in Denton County were already indicative of unchecked community spread of the Delta variant.
4/ AND THE SCHOOLS STARTED WITHOUT A MASK MANDATE. This is an absolute point to hammer home over and over again. ACCEPTED MEASURES OF PANDEMIC ASSESSMENT WERE CRITICAL BEFORE SCHOOL STARTED. If this isn't endangerment of the children of our community on a mass scale, I don't know what is.
PARTING THOUGHTS
Spare me your childish diatribes about freedoms, liberty and personal responsibility. It has been 554 days in this pandemic since the Great Lockdown on March 14 last year and if it's on thing this pandemic is shown, self-governance is not the strongest attribute of our society.
We can't predict which kids will get severely ill, which kids will end up with late critical complication called MIS-C (Multisystem Inflammatory Syndrome due to COVID). And this is before we get into an accounting of all the teachers and school staff at risk. Approximately a tenth of the educators who have died from COVID in this nation have come from Texas.
Each time we have reached a new low point that I thought was the most demoralizing thing I have ever seen in my medical career, the bar manages to get set even lower and the race to the bottom of the barrel in a barren desert of human empathy rages on.
Those of us in health care are exhausted already.