
PEDIATRIC COVID DATA/DENTON COUNTY, TX/JANUARY 21
PEDIATRIC COVID DATA/DENTON COUNTY, TX/JANUARY 21
The fallacy of "business as usual" in unusual times

Six graphs in today's post, all data either from Denton County Public Health or public COVID dashboards like COVIDCast and COVIDActNow.
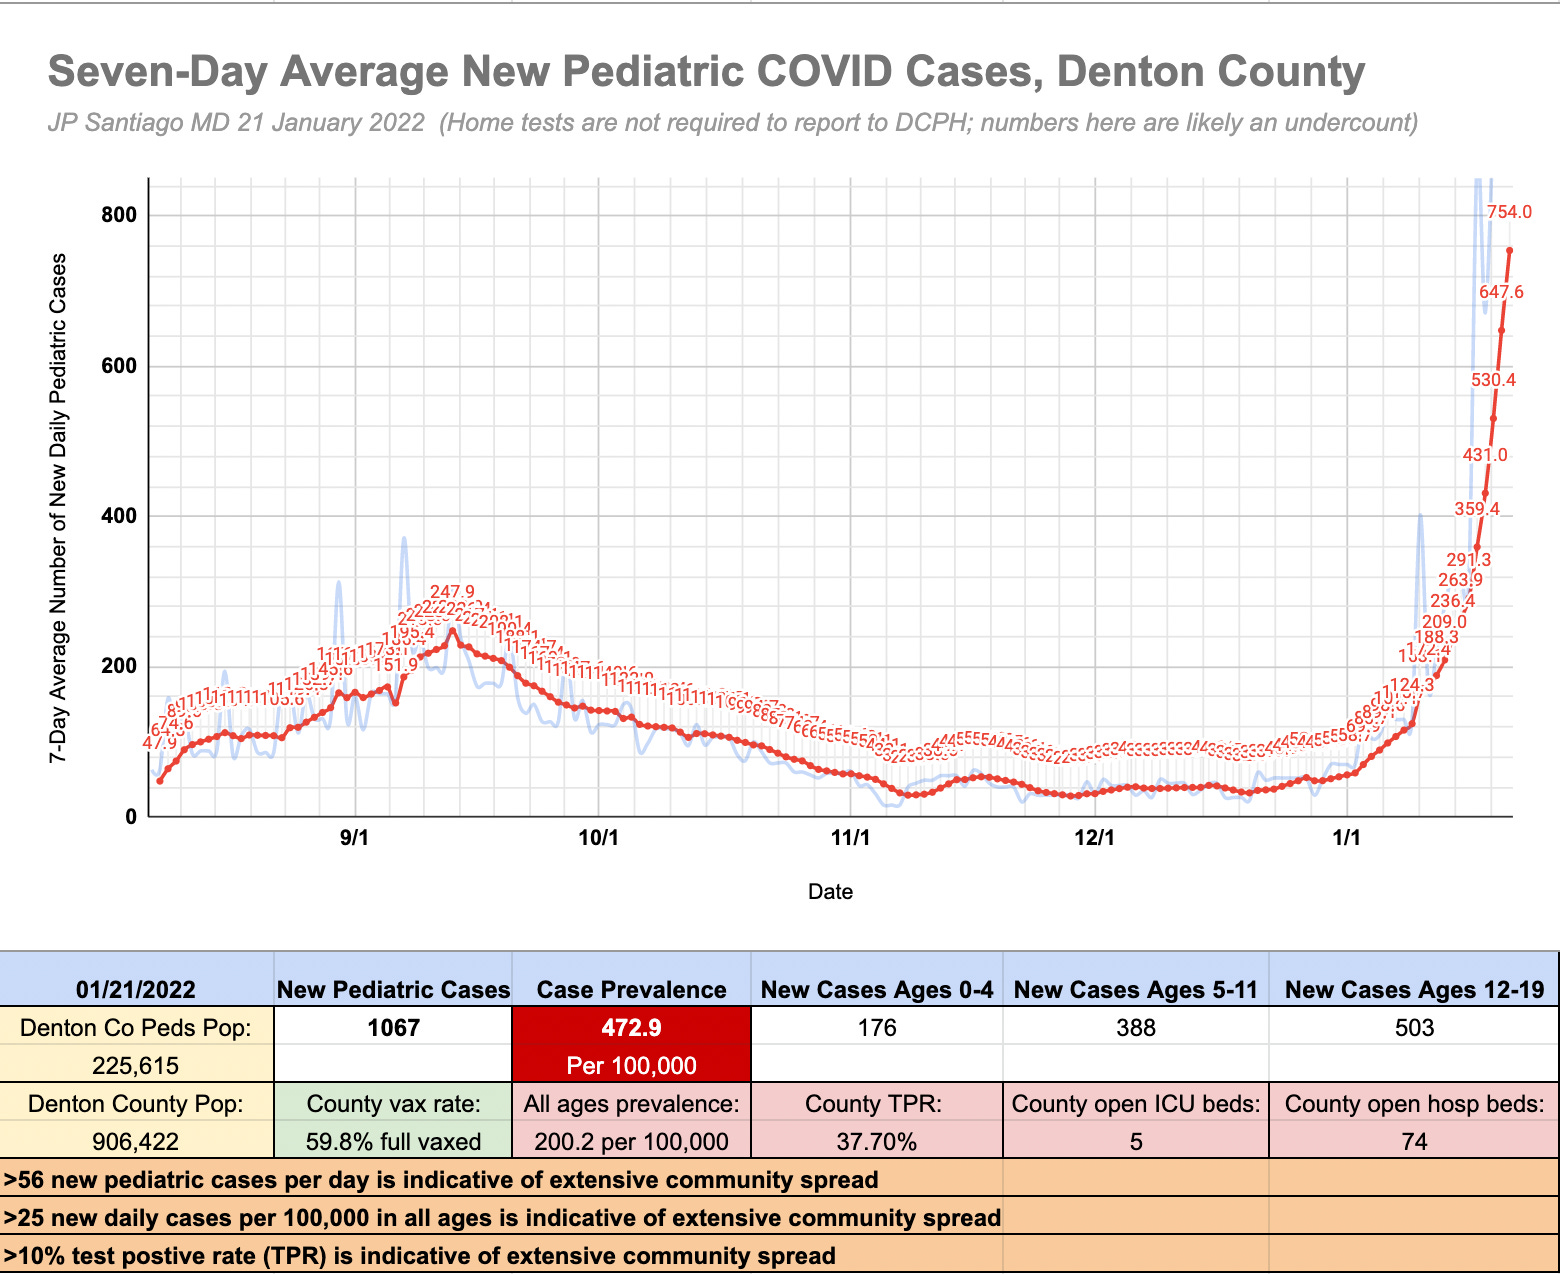
First graph- or shall I say "Dumpster Fire, People's Exhibit A"?- is the seven day average of new daily pediatric cases in Denton County along with several relevant stats for the county. The faint blue line represents the new pediatric COVID cases reported each day. As of this past Friday, we had 5 open ICU beds and 74 open hospital beds in Denton County. 59.8% of the county is fully vaccinated, but that leaves just over 362,000 unvaccinated who are extremely vulnerable to severe Omicron infection. In the past week, I have had to reformat the vertical axis of my graphs each of four days as the jump in pediatric cases was so significant each day.
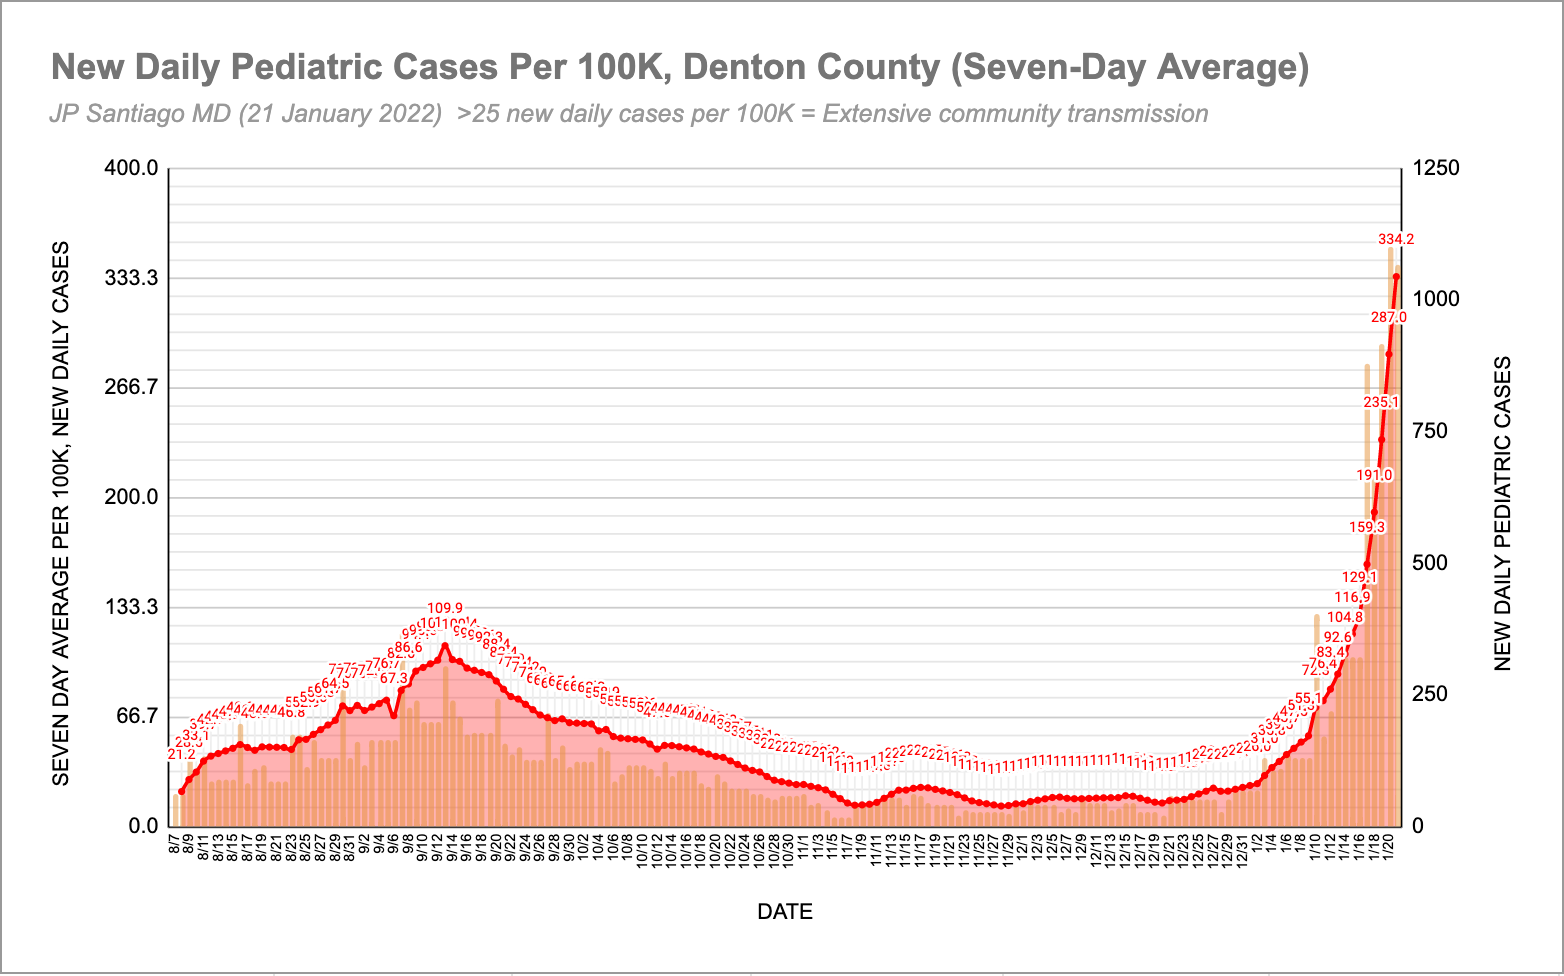
The second graph (Dumpster Fire, People's Exhibit B) is the same data, but as a seven day average of pediatric cases per 100,000, using the pediatric population of Denton County as the cohort (225,615 kids in our county). The orange vertical bars the the new pediatric COVID cases reported each day. Incidents per 100K is a standard way of expressing prevalence of a given disease state in a population and it allows us to compare two different sized populations.
Note that the latest seven day rolling average is 334.2 new pediatric cases per 100,000 but the first graph shows the pediatric case prevalence at 472.9. Why the difference? The pediatric case prevalence on the first graph is just for that single day (Friday, January 21) but the data plot on the second graph is a seven day rolling average. Essentially the same data, just calculated differently.
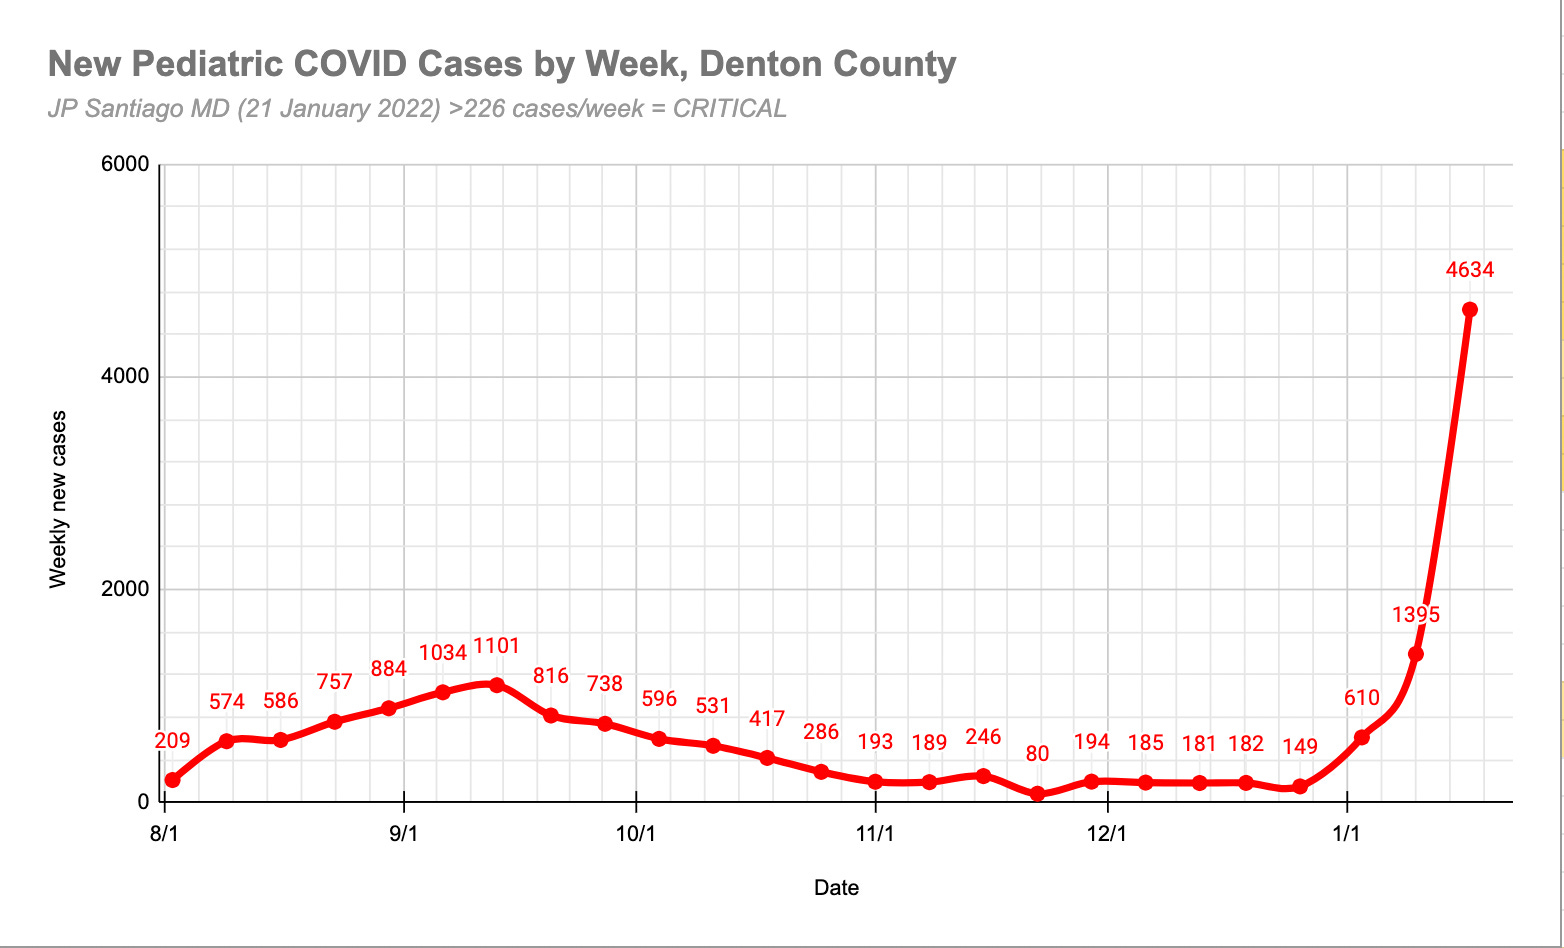
Third graph is also the same data from DCPH but I've displayed it as weekly total of new pediatric COVID cases. For the population of Denton County, anything over 226 cases per week is indicative of extensive community spread. We are TWENTY-ONE TIMES that threshold this past week.
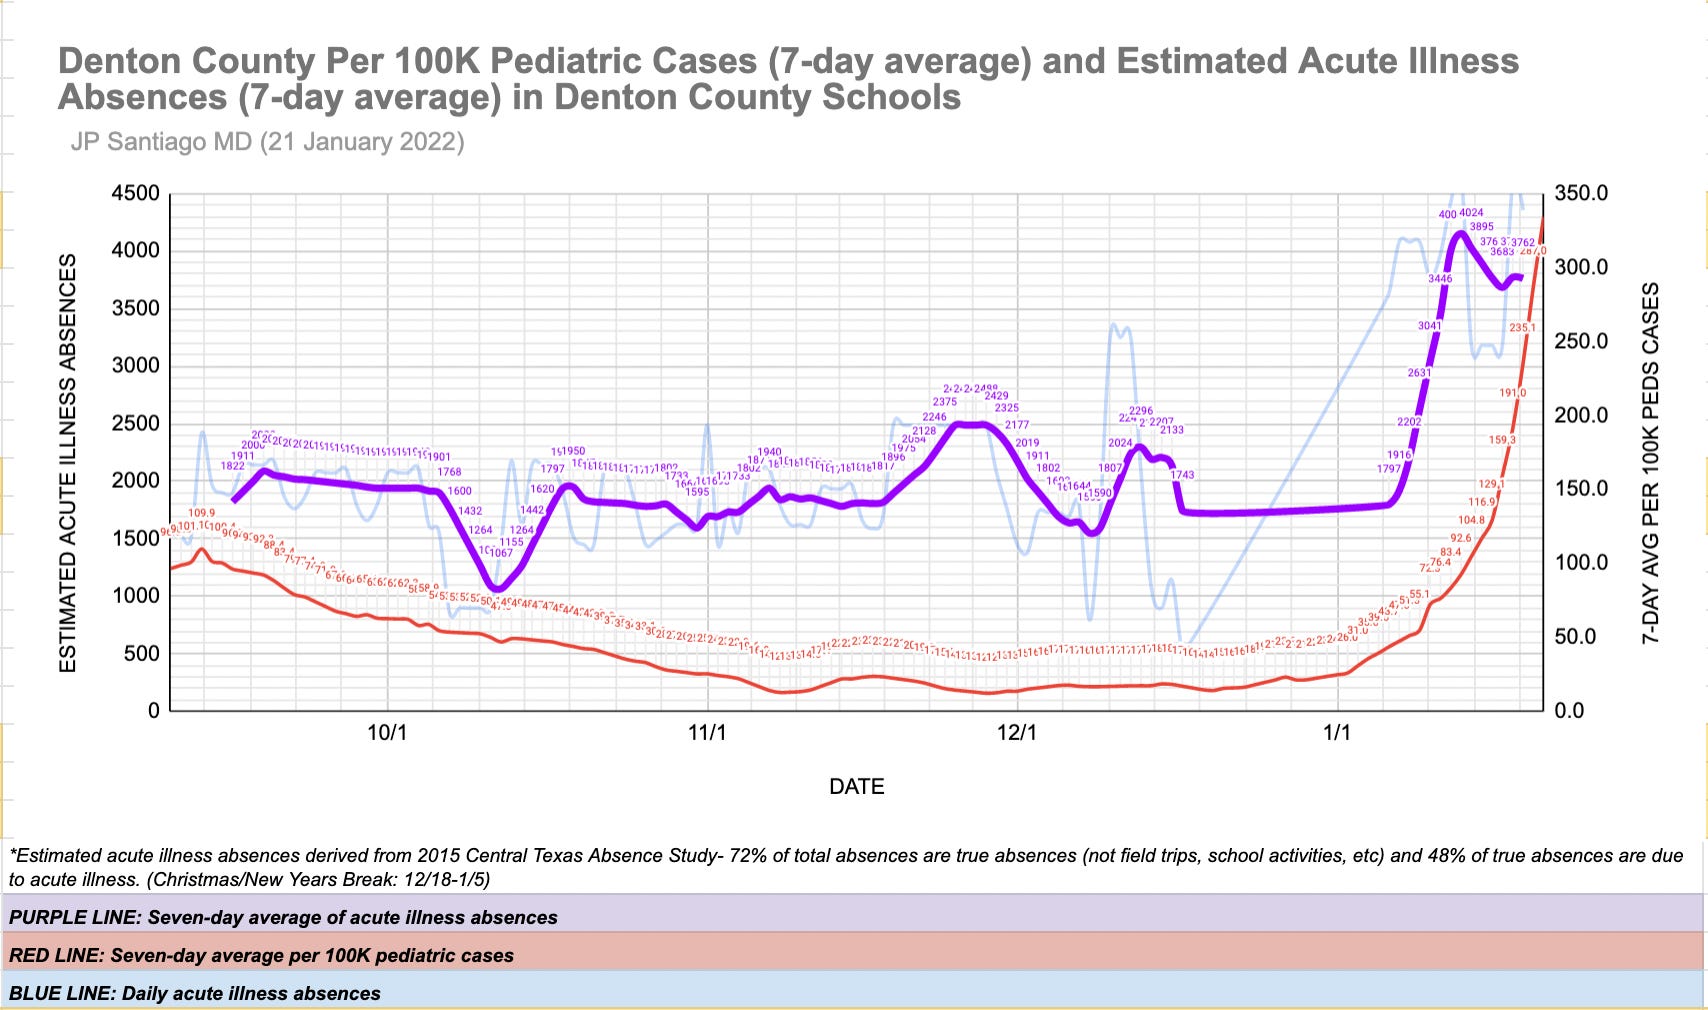
The fourth graph compares the estimated acute illness absences in Denton County (seven day average) with the seven-day average of new pediatric cases per 100,000 in our county. Take that peak and drop in estimated acute illness absences with a grain of salt- usually the daily absence data is incomplete for the prior 2-3 days due to reporting delays. Absence data is useful as it is not reliant on testing and not reliant on parents to disclose positive cases. It's a form of syndromic surveillance much like what we have done with influenza surveillance for decades.
The absence data gives us a clue to how many kids are actually sick. While that number in of itself should not be considered definitive, like any bit of pandemic data, it always has to be viewed in the context of other data streams. In this case, we can see that the estimated acute illness absences correlate with the rise of new cases in among kids in Denton County.
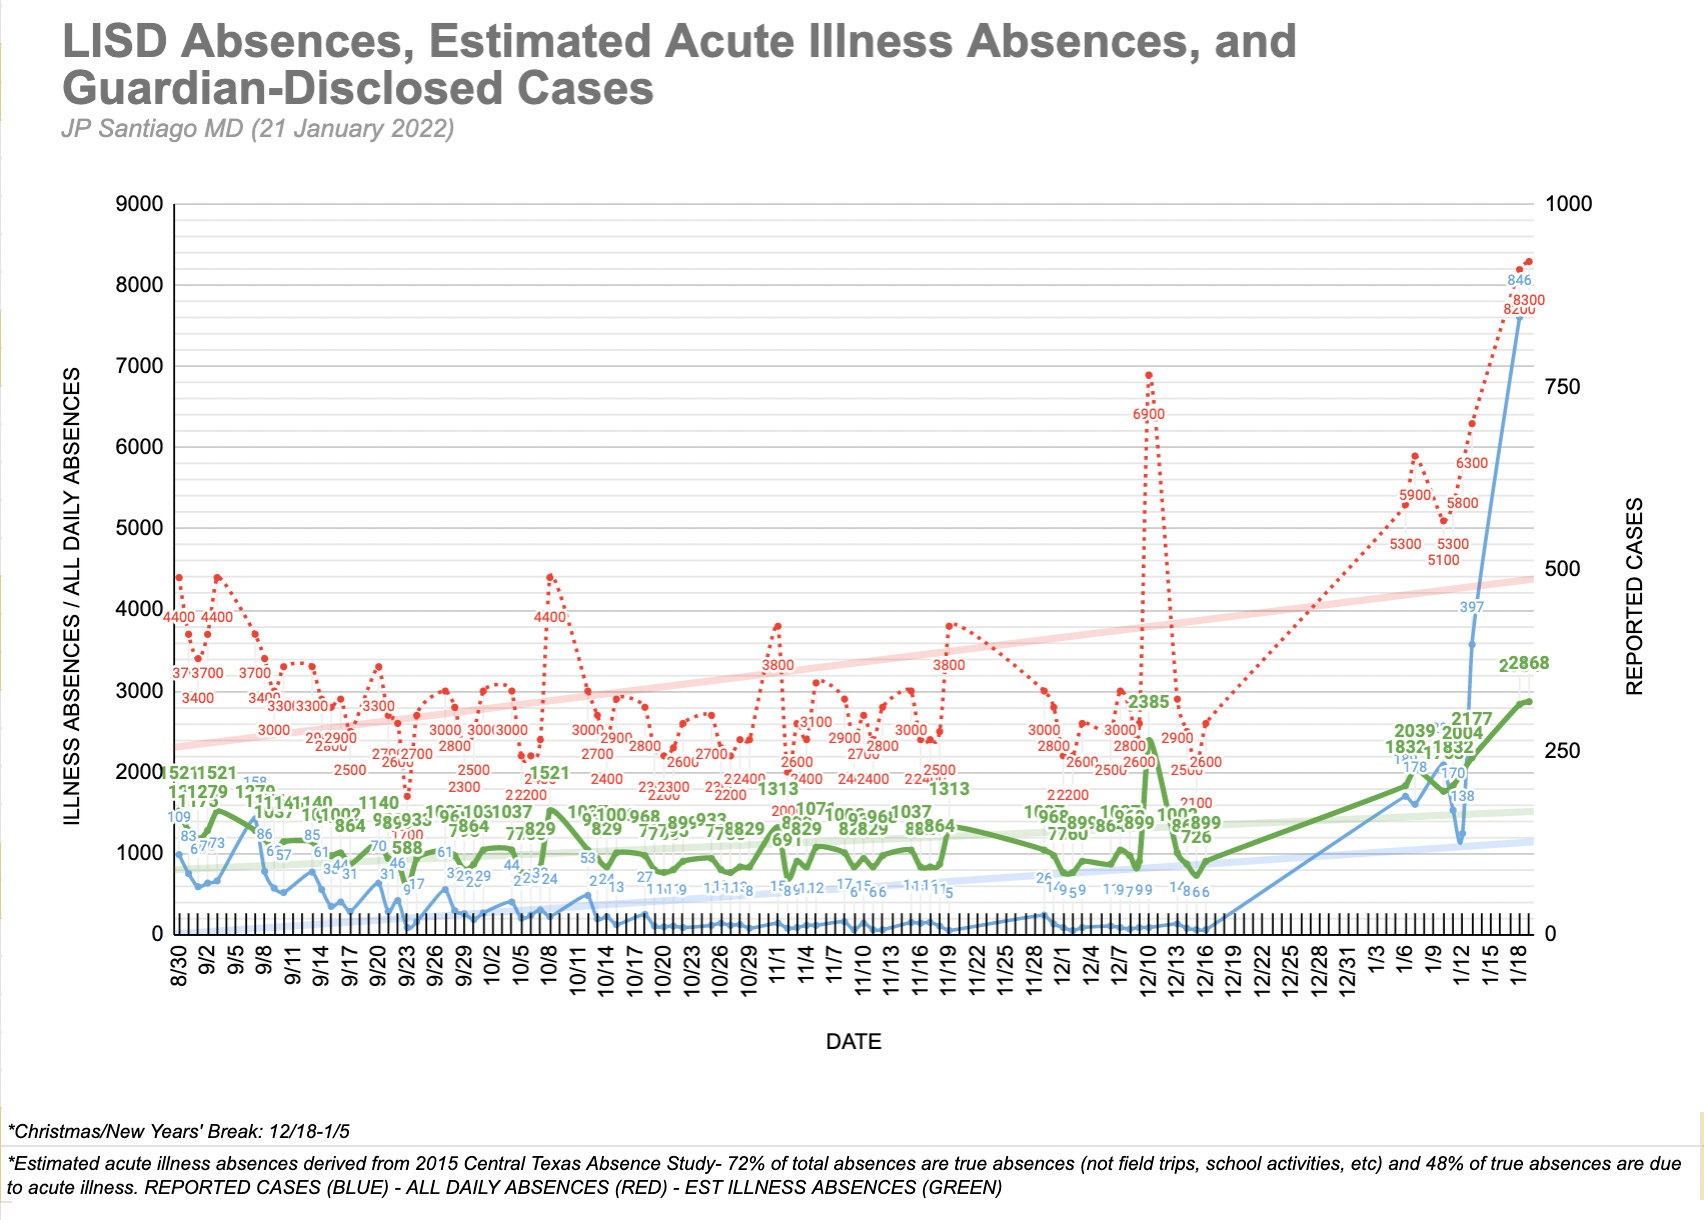
The fifth graph is a work in progress and I'm looking at ways to improve the data presentation but it is charting daily absences in Lewisville ISD, the estimated acute illness absences in the district, and the number of parent-disclosed positive cases.
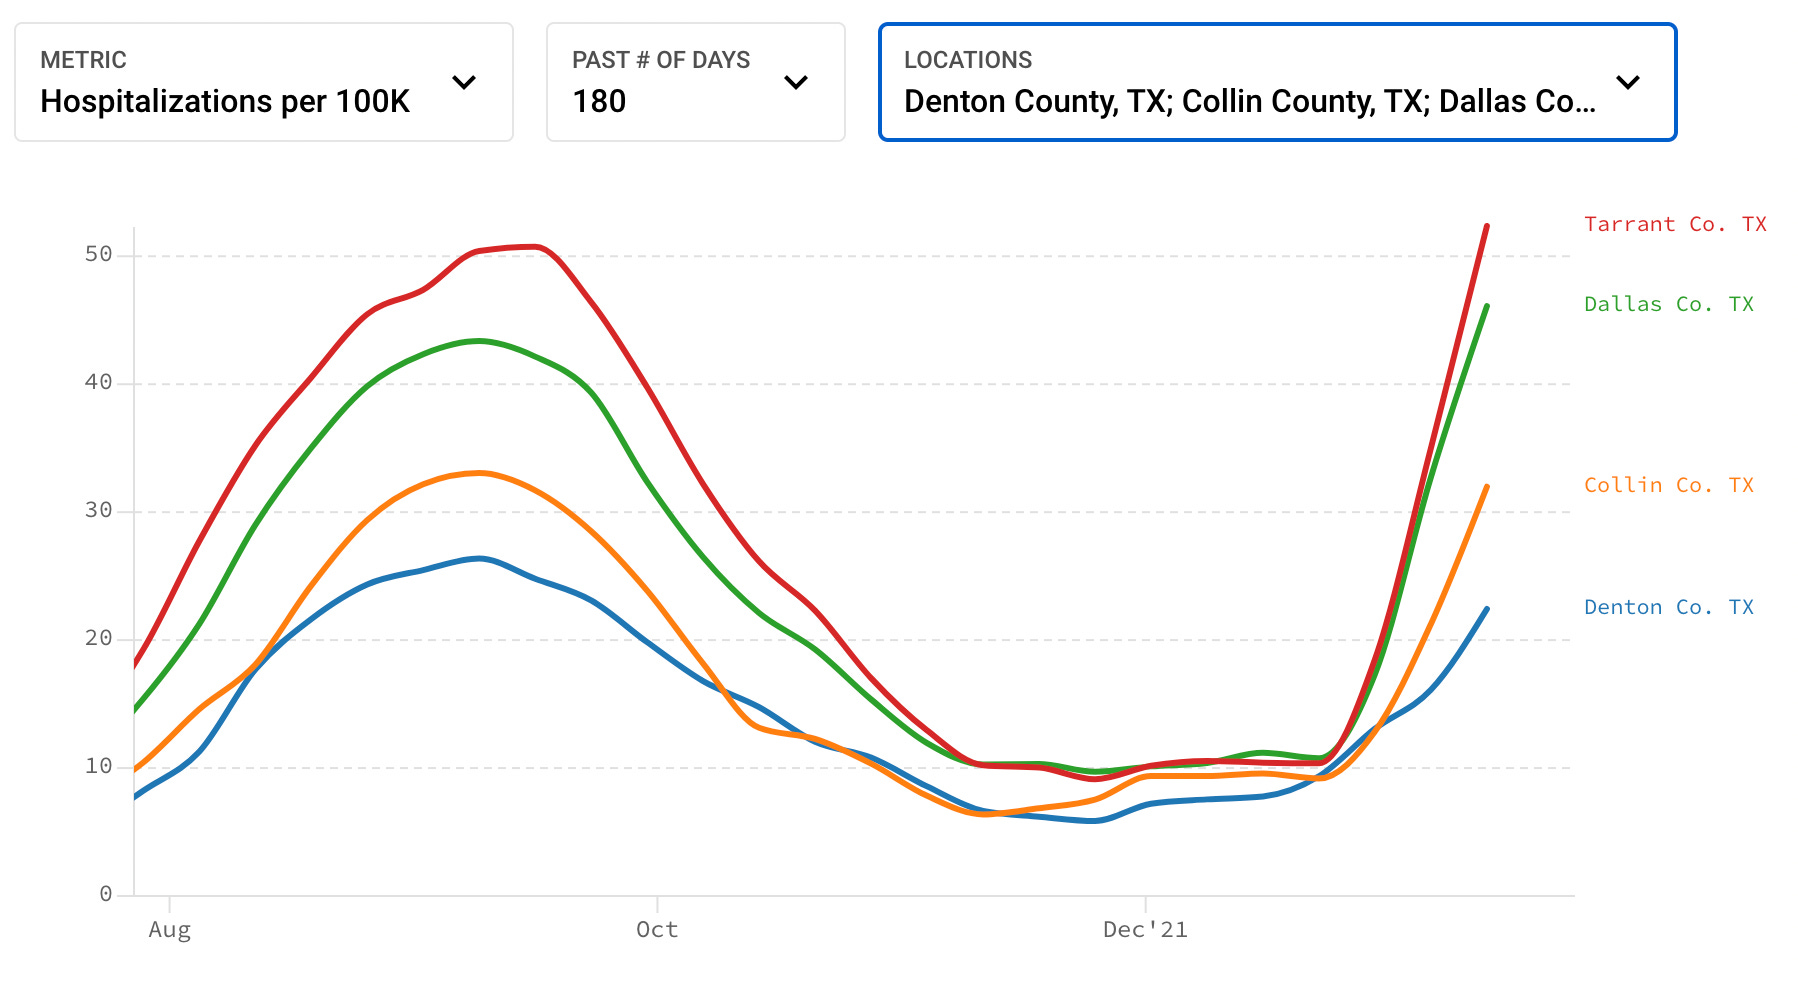
The last graph shows hospitalizations per 100,000 people for the four most populous counties of the DFW Metroplex. Hospitalization trends have not shown any signs of slowing down this past week. That is NOT who gets hospitalized for COVID out of those with infected, but the prevalence of COVID hospitalization for everyone in each county, infected or not. Because the large hospitals in Dallas and Tarrant County are the tertiary referral centers for the surrounding communities and counties, any strains on the hospitals in Dallas and Fort Worth are of significant consequence to EVERYONE in the Metroplex and even beyond.
TAKE HOME MESSAGES
1/ An email from the interim superintendent of Lewisville ISD sent out this weekend disclosed that 1/5 of the teaching staff is out due to COVID. Stories abound in all the parent social media groups on how ineffectual the substitute teaching (if you can call it that) has been to try and cover those staff absences. Keep in mind that many teachers also have children who are students in the district. A sick child can take a teacher out of the school just as easily as that teacher being infected with COVID.
Just several days before, the interim superintendent said the following in an email to parents: "as a district we must learn to function with COVID-19 and its variants as part of our day-to-day operations."
Well that sure aged well over the course of what, three days?
2/ The largest congregate gatherings in each community each weekday are our schools. No other organization in our county gathers as many people into communal spaces without a mask mandate on such a regular basis. Epidemiological data from around the world has repeatedly shown that schools are a major driver of community transmission of COVID. It is possible to have in-person learning using best medical practices ranging from a mask mandate to social distancing measures. It is NOT SAFE for our community for the schools to have in-person learning WITHOUT those best medical practices. You decide if that constitutes willful endangerment of not just the kids, but their families as well.
3/ Let me iterate that a milder virus that is more contagious is a bigger threat to health care systems and the communities they serve than a more lethal virus. Indications are that Omicron results in less hospitalizations than Delta, HOWEVER its much more contagious than Delta. Let's say for discussion purposes that Delta infects 2 people for every infected and 5% are hospitalized with serious disease. Now let's say (again for discussion to keep the math simple) Omicron only lands 2% of people in the hospital but infects 8 people for every infected person.
If we have 100 people with our hypothetical Delta example, 5 are hospitalized. After one cycle, we now have 300 people infected, another 5% of the 200 newly infected land in the hospital, that's 10 additional people in the hospital for a total of 15. If we go a second cycle, those 300 infect another 600, 5% of them is 30 so now we have 45 in the hospital after two cycles.
If we have 100 people with our hypothetical Omicron example, 2 are hospitalized. After one cycle we now have 900 people infected, another 2% of the 800 is an additional 16 in the hospital for a total of 18. If we go a second cycle, those 800 infect another 6400. 2% of that 6400 is 128, now we have 146 in the hospital after two cycles.
4/ Data from South Africa and the UK that suggested Omicron was milder doesn't necessarily apply to the United States. First of all, Omicron emerged in South Africa during the summertime in the Southern Hemisphere. Omicron is here in the United States during the colder winter months when more people are crowded indoors. Europe is in their winter as well but their hospitalization data is not as bad as the United States as they have lower rates of the medical conditions that constitute high risk conditions for severe COVID infection- lower rates of obesity, diabetes, heart disease, and so on.
5/ Focusing on the impacts of COVID being "mild" in kids fails miserably at recognizing that each child is a part of a family and each family is part of a community. Every student in the school districts and every child in this county is part of a household and that household may have family members who are at risk for serious COVID infection in unvaccinated or getting infected despite vaccination. It may be age, cancer treatment, obesity, high blood pressure, diabetes, heart disease, chronic lung disease. Approximately 65% of American adults have at least one risk factor for serious COVID infection. That means the majority of kids have at least one parent or two who are at high risk of serious infection. There are also siblings who are under the age of 5 and too young to get vaccinated. Enacting a mask mandate and earnest social distancing measures in the schools doesn't just protect our children, it protects their families as well.
For school districts to continue not do their part in this Omicron wave in the face of the data is an extraordinary failure in citizenship and moral leadership.