
PEDIATRIC COVID DATA/DENTON COUNTY, TX/JANUARY 28
PEDIATRIC COVID DATA/DENTON COUNTY, TX/JANUARY 28
If the school district leadership were my employee, I'd fire them for incompetence or put them on a performance improvement plan.

Four graphs in tonight's pediatric COVID data update for Denton County. The data for tonight's review was the Friday data release from Denton County Public Health. DCPH releases case data each weekday afternoon between 300pm and 400pm and since August, I have been extracting the pediatric data from what is publicly released.
The data release from this past Friday, January 28 shows that may be on the backside of an Omicron peak, but that's not clear just yet and I'll discuss that further down in tonight's review.
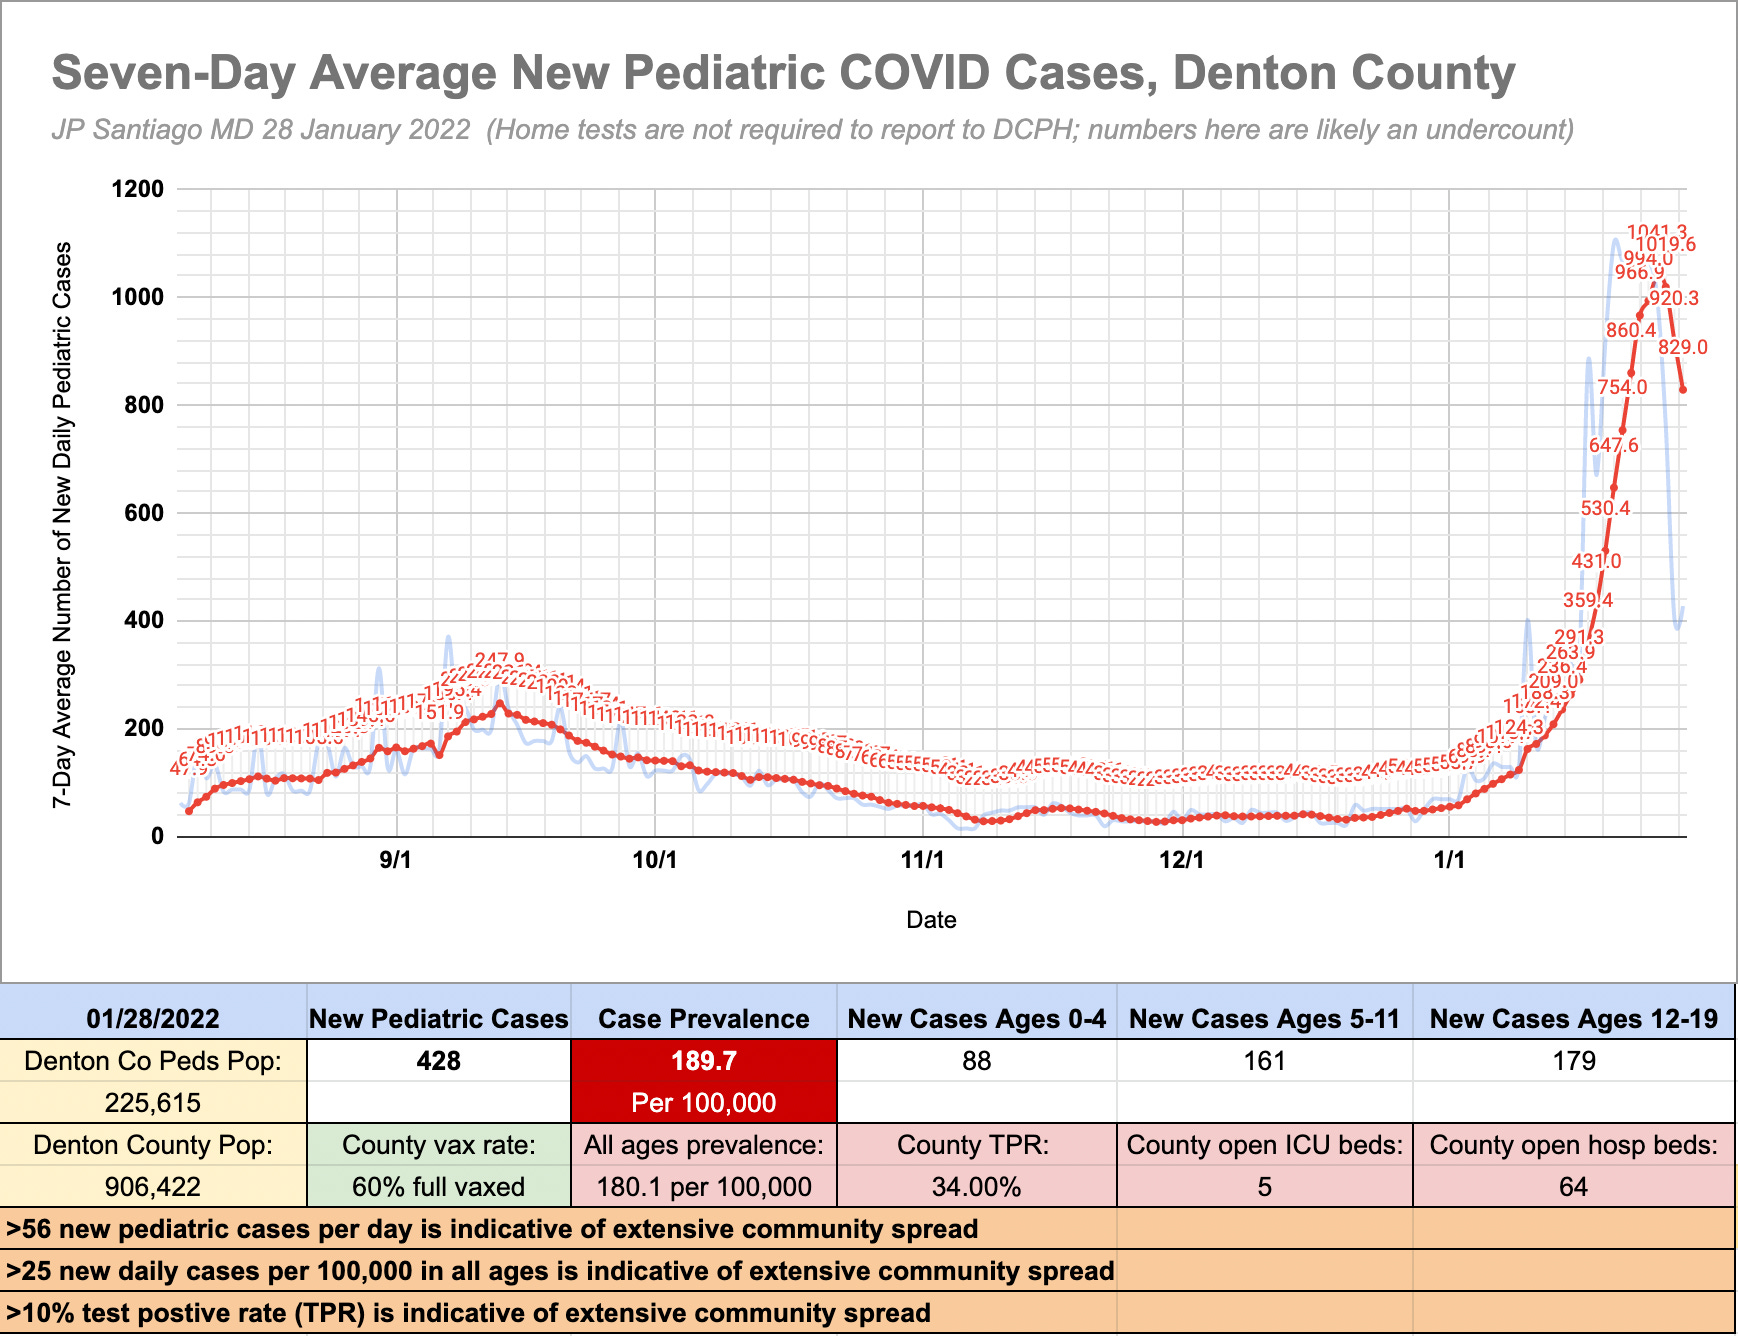
The first graph shows both the seven day average of new pediatric COVID cases in Denton County (red line). The faint blue line is the actual COVID cases in county residents under the age of 19 each day. At the bottom I have some pandemic environment parameters for January 28 which include the vaccination rate, hospital/ICU bed utilization, the overall test positiver rate for that day as well as the pediatric prevalence versus the prevalance across all age groups in the county.
The orange boxes at the bottom of the first graph are key pandemic parameters that tell us if we are still in critical territory with our numbers. For a county the size of Denton County with a pediatric population of just over 225,000, anything more than 56 new cases per day is indicative of extensive community spread. Across all ages, anything more than 25 new daily COVID cases per 100,000 is indicative of extensive community spread. And finally, a test positive rate greater than 10% means viral spread is outpacing testing surveillance and there is not enough testing taking place to catch all positive cases and test their close contacts.
We are STILL in critical territory in all three of those parameters- the latest seven day average of new pediatric COVID cases is 829/day (should be under 56/day for Denton County's population), the new daily cases prevalence across all age groups on Friday was 180.1 per 100K (should be <25 per 100,000) and the test positive rate was 34% (should be under 10%). That means on Friday, 1/3 of all COVID tests done that were reported to DCPH were positive. It has never been at that level during our Alpha or Delta surges.
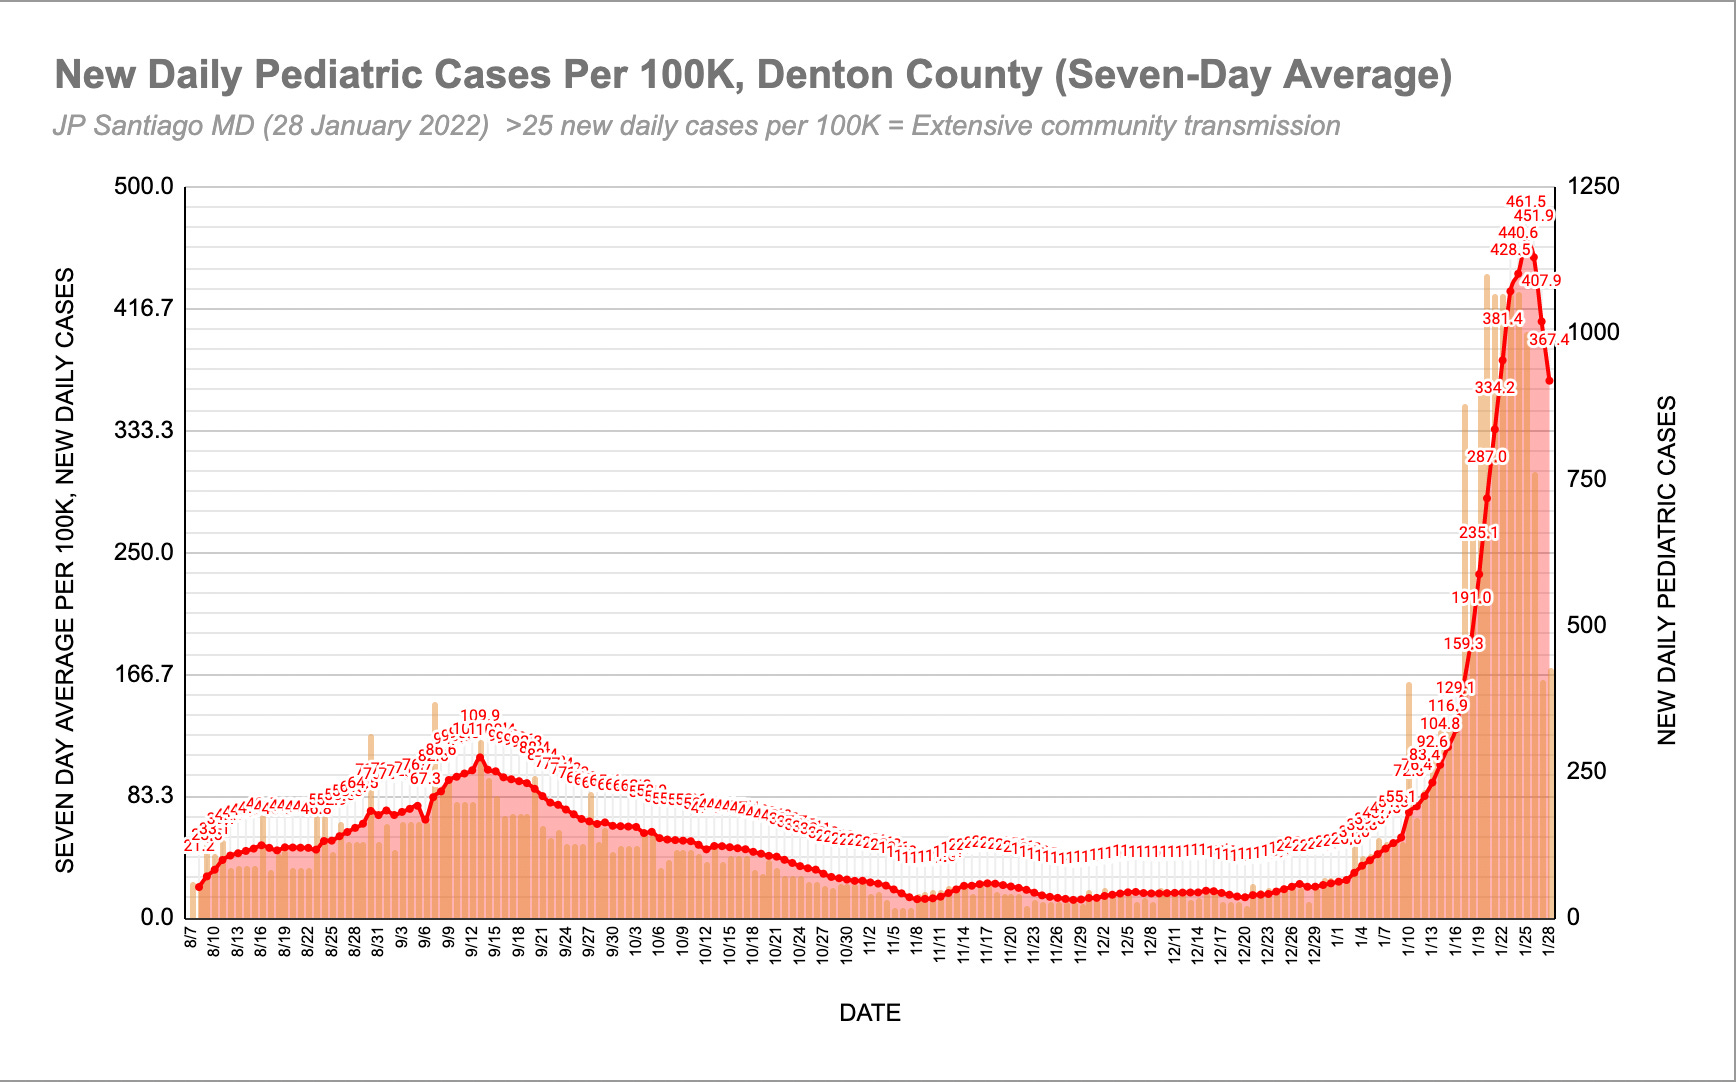
The second graph is the same data but presented as a seven day average per 100,000 residents, a standard method of expressing case prevalence in medicine. The faint orange vertical bars are the new daily cases for each day in those <19 years of age in Denton County. If we were to use the pediatric population of Denton County as our cohort (just over 225,000 kids), then the pediatric prevalence as a seven day rolling average on Friday was 367.4 per 100,000 kids.
If we were looking at just kids, that should be less than 25 new daily pediatric cases per 100,000 in our county. We have not been at that level since before the week of Christmas. Think about that for a second.
BEFORE the start of the spring semester in our school districts, pandemic parameters were already at critical levels.
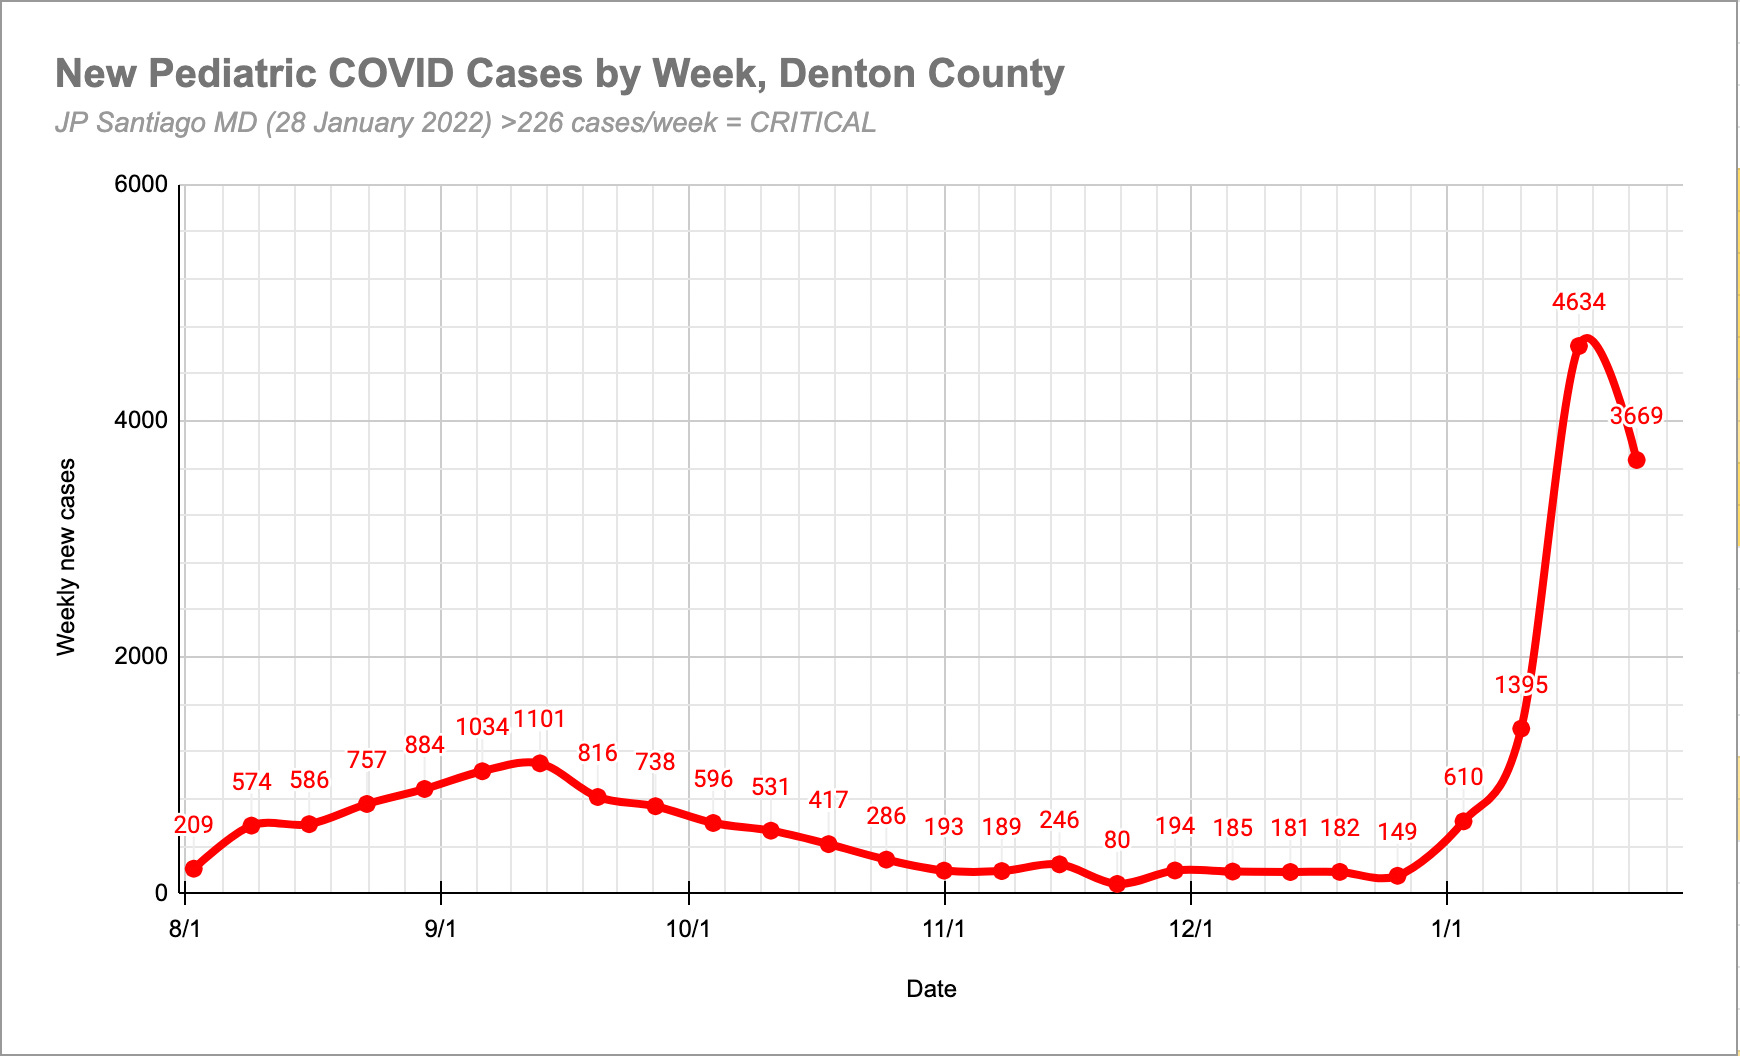
The third graph is the same data but cumulative cases each week in the pediatric population of Denton County. For our population, anything more than 226 new pediatric cases per week would be critical. Again, you can see we have not been at that low risk level since before the Christmas break and we have handily exceeded in our county the high water marks set during the Delta surge in September.
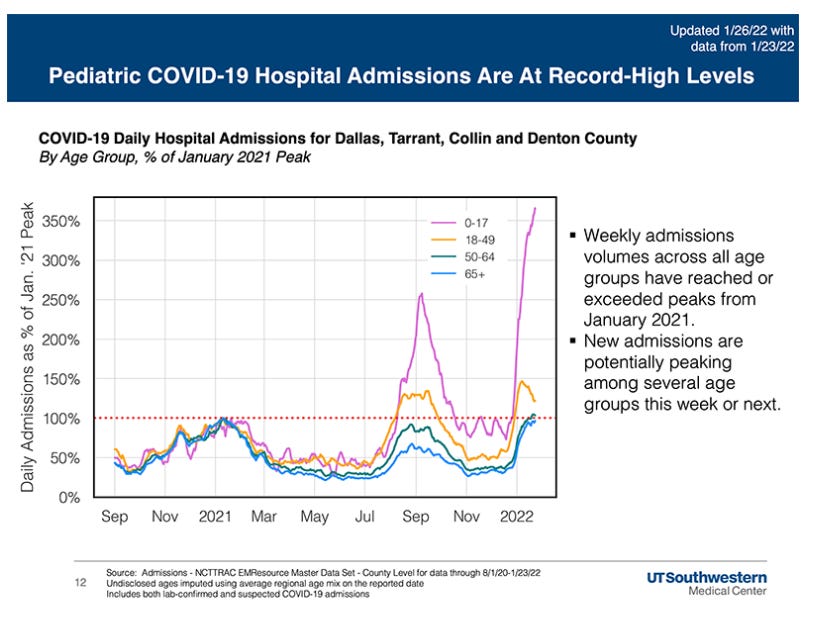
The fourth graph comes from University of Texas Southwestern Medical Center's weekly COVID update. This graph shows the number of hospital admissions asa percentage of the January 2021 peak during the Alpha surge which was the prior hospitalization high water mark in the Dallas/Fort Worth Metroplex. Note that most dramatic increase in hospital admissions in BOTH the Delta surge in September and the current Omicron surge now hav been in the pediatric age group.
Think about that for a bit here.
The biggest increase in DFW hospitalization rates in BOTH the Delta surge and the current Omicron surge have been in kids.
IN CHILDREN.
This represents an extraordinary failure on the part of many school districts in the DFW area to take proper measures to protect their students not ONCE during the Delta surge, but a SECOND time during the Omicron surge. My home school district, Lewisville ISD, has over 50,000 kids enrolled yet we are continually faced with a remarkable degree of obstinacy from our school board in enacting best medical practices based on consensus evidence of what works in pandemic mitigation.
You be sure to keep that in mind when the next school board elections take place. Who was entrusted with the welfare of your children and failed in their duties?
Lewisville ISD is the biggest school district in Denton County based on enrollment so what is done or not done in terms of pandemic mitigation by LISD has a significant impact on county numbers. The district shut down last Wednesday and is reopening tomorrow. But cases were already decelerating PRIOR to the closure of the district last week.
What does this mean in terms of where things will go when the district reopens absent best medical practices for pandemic mitigation?
SCENARIO ONE: Since we don't know the full extent of asymptomatic infection in kids with Omicron, if it were significant, then cases will continue to drop as the majority of kids are either exposed, infected, or vaccinated.
SCENARIO TWO: Absent best medical practices for pandemic mitigation that set up this shut down to begin with, reopening of the district will result in plateau of cases at a high level, then a return to the case increase perhaps by next week. It will look like a double peak with a higher second peak my graphs.
SCENARIO THREE: Reopening of the district absent best medical practices for pandemic mitigation will result in a slow decline with a possible plateau of cases above the pre-Omicron baseline.
SCENARIO FOUR: Any of the previously mentioned scenarios with a surge in late February driven by the Omicron sub-variant BA.2 that has just been detected in North Texas. There are some new mutations BA.2 that raise the distinct possibility that it can better evade our immune system than Omicron could as well as some mutations that may further enhance it's contagiousness. As BA.2 is new on the scene, there is a frenzied amount of scientific work underway to fully characterize what BA.2 can and can't do. Indications from Europe are that we need to be prepared for the possibility that this Omicron sub-variant looming on the horizon can cause more disruptions in our schools.
If I had an employee who did the same thing the same way several times in a row and got the same wrong outcome, I'd either fire them for incompetence or put them on a performance improvement plan.
Our schools are the largest congregate gatherings in our county each weekday and weekends as well if you count extracurricular activities. To not take action based on medical and scientific evidence threatens not just the well-being and health of our children but the well-being and health of everyone in the community.