
PEDIATRIC COVID DATA/DENTON COUNTY/January 14
PEDIATRIC COVID DATA/DENTON COUNTY/January 14
There's a lot about this I didn't envision, but here we are.

Six graphs this evening in this data update.
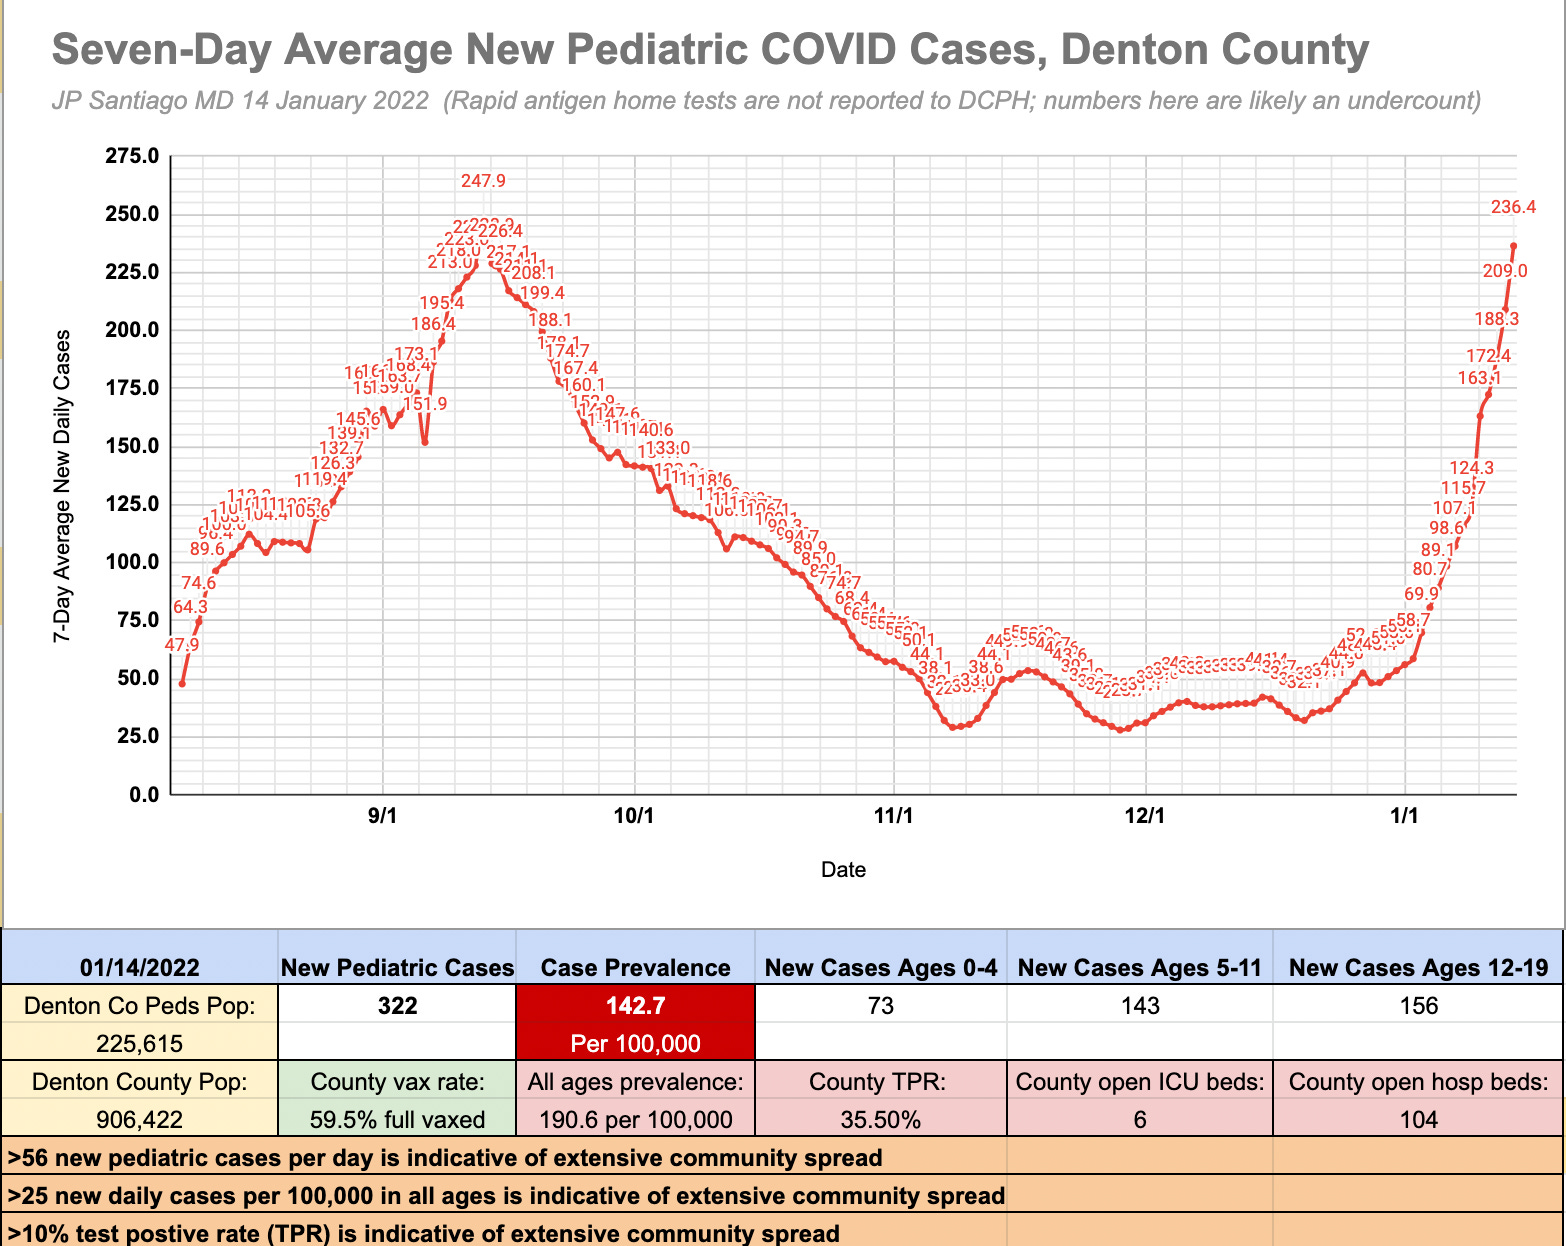
The first graph is the seven day average of new pediatric COVID cases in Denton County. In the last seven days we have been averaging 236.4 kids diagnosed with COVID each day. We are not far off the high water mark during the Delta surge. For context, it took 36 days to reach that point from a starting point of 50 new pediatric COVID cases per day. With Omicron, it has taken us only 15 days to reach levels that match where we were with the Delta surge in September. This is highly indicative of Omicron's high contagiousness in the setting of little to no mitigation measures in the school districts of Denton County.
Test positive rates continue to be quite high at 35.5% (over 1/3 of COVID tests done that are reported to DCPH are positive). The highest our TPR has gotten in the DFW Metroplex was 23.3% and that was January 7 a year ago during the Alpha surge. The max TPR we got during the Delta surge was on August 12 at 17.8%. I have not seen a TPR this high in our area in the two years that I have been following pandemic data trends.
36 days versus 15 days. This is sharper trajectory than I had anticipated and am now unsure of the three day holiday weekend or partial district closures next week will alter this trajectory. Next week's data from Denton County Public Health should be instructive.
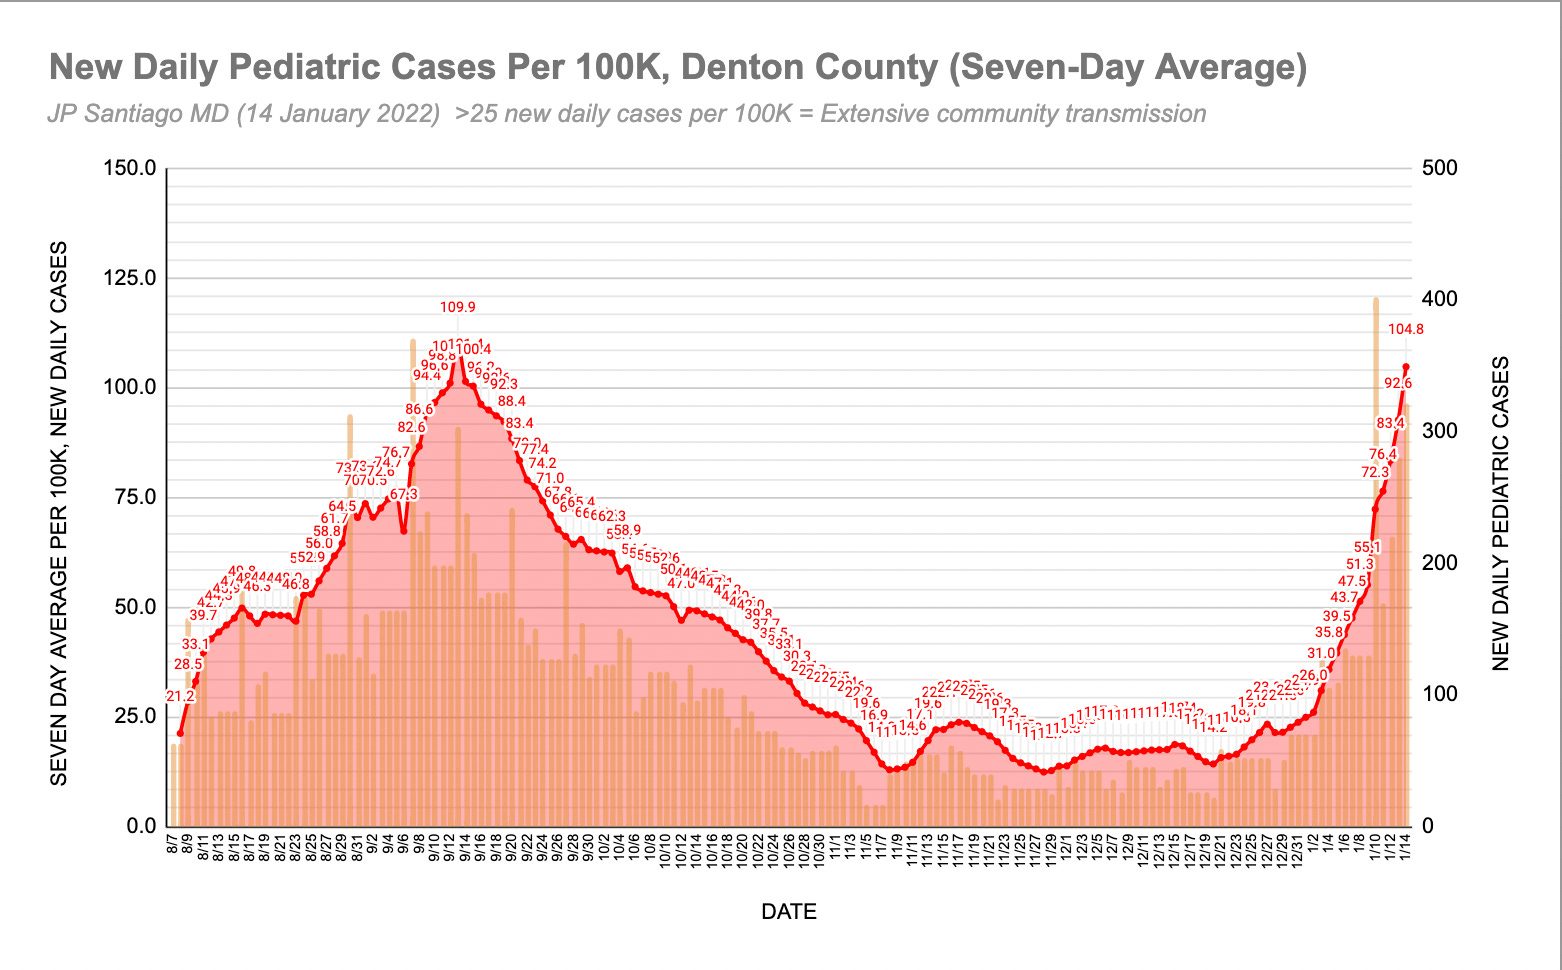
The second graph is the same data but plotted as new daily pediatric cases per 100,000 using the under 19 age group of Denton County as the cohort. About 25% of Denton County's population is under 19- that comes out to about 225,000 kids in Denton County.
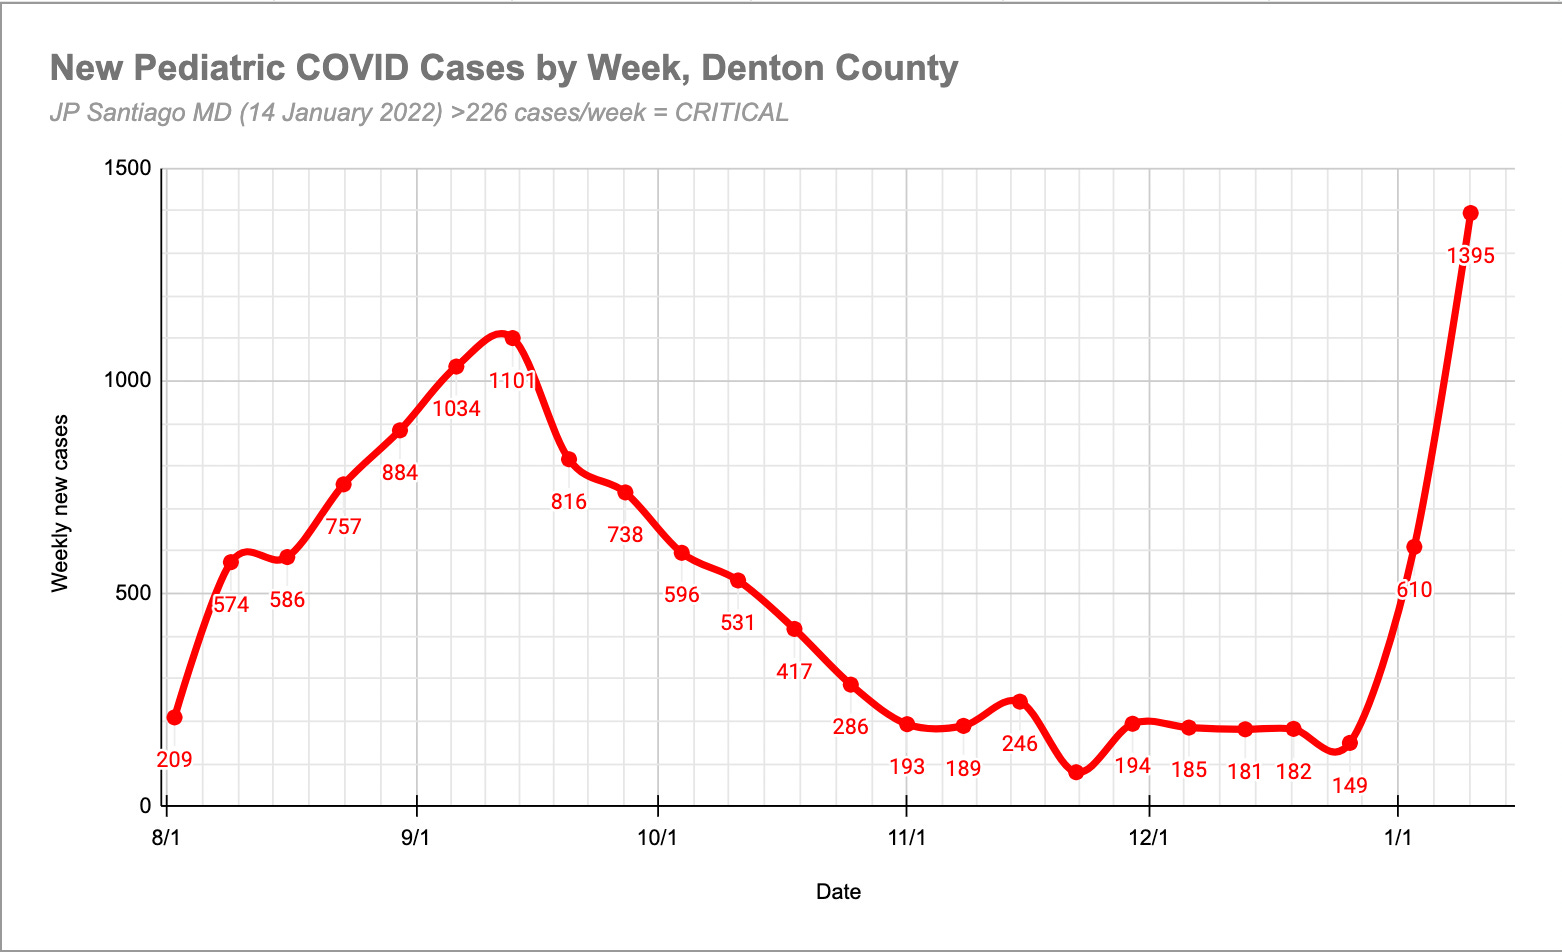
Third graph is the number of new pediatric cases per week in Denton County. Again the sharp increase with Omicron is clearly evident.
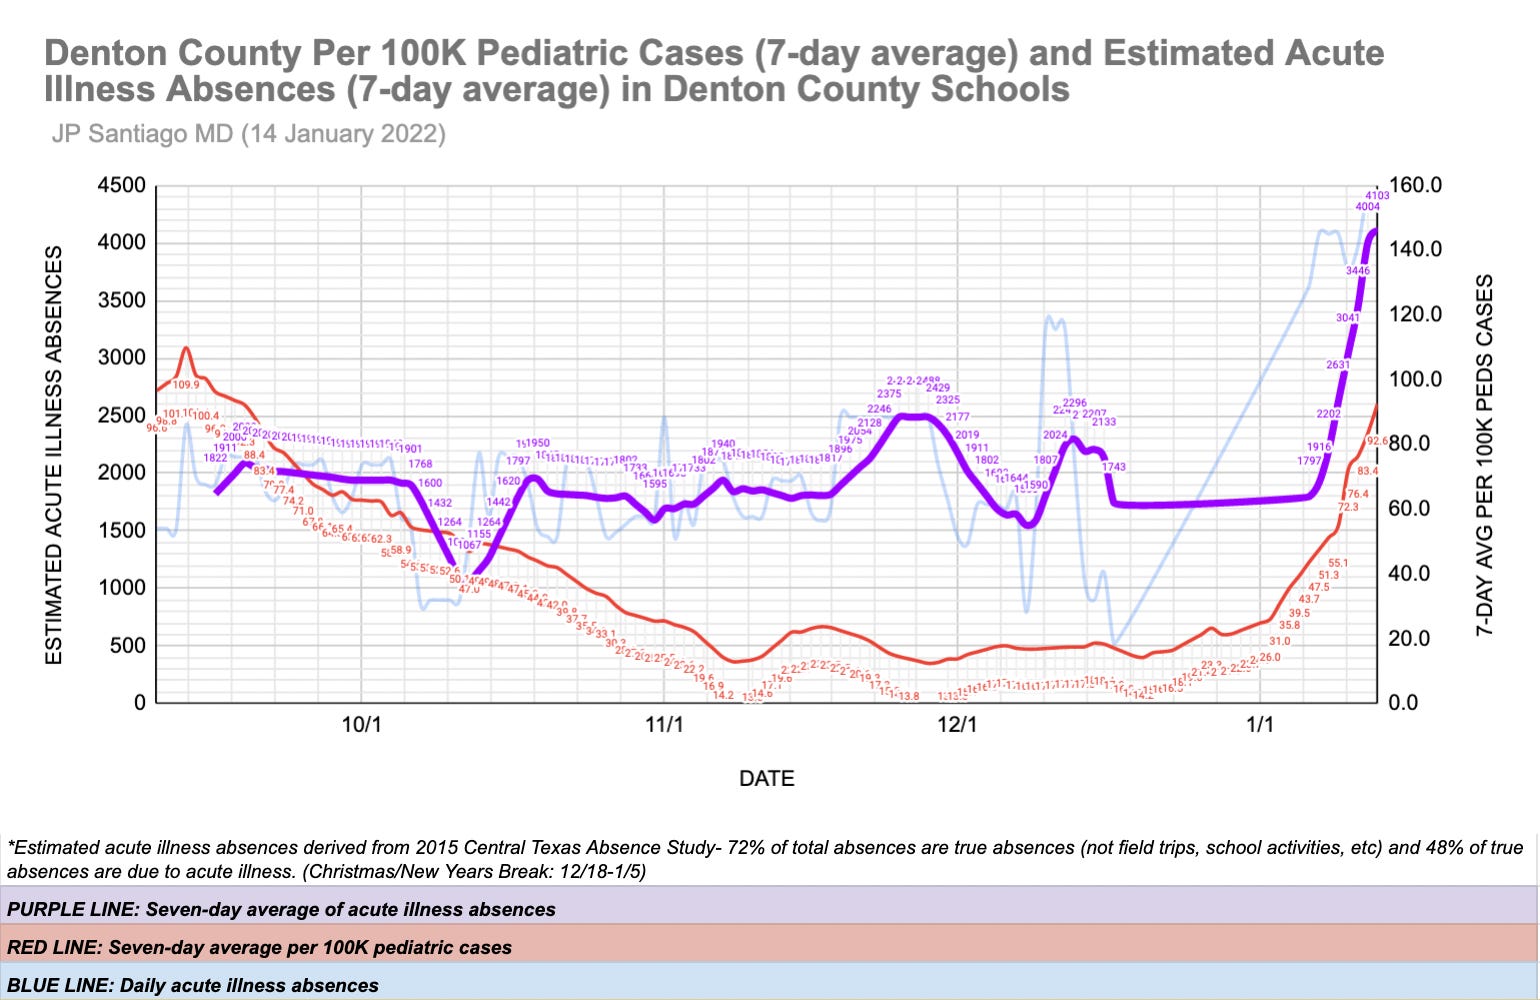
The fourth graph compares the new daily pediatric cases per 100,000 with the estimated daily acute illness absences for the county. I estimated the daily acute illness absences based on the findings of the 2015 Central Texas Absence Study. In that study, 72% of all absences are considered true absences (not field trips, school activities). Of those true absences, 48% are acute illness absences- most commonly upper respiratory tract symptoms or gastrointestinal illness. Both of those symptom categories are possible presenting COVID symptoms.
The light blue line is the daily acute illness absences and the purple line is the seven day average of estimated acute illness absences across all of Denton County. You can see that the trends in absences match up well with the case prevalence of COVID in the pediatric population of Denton County. As absences are not reliant on testing, it is considered a durable parameter particularly given that testing is being overwhelmed right now in the DFW area and home tests are not counted in the official numbers.

The fifth graph shows the trend in new daily cases in Denton County across all age groups. The rapid climb to levels we have never previously seen in this pandemic are unprecedented and consistent with what we know about Omicron's contagiousness.
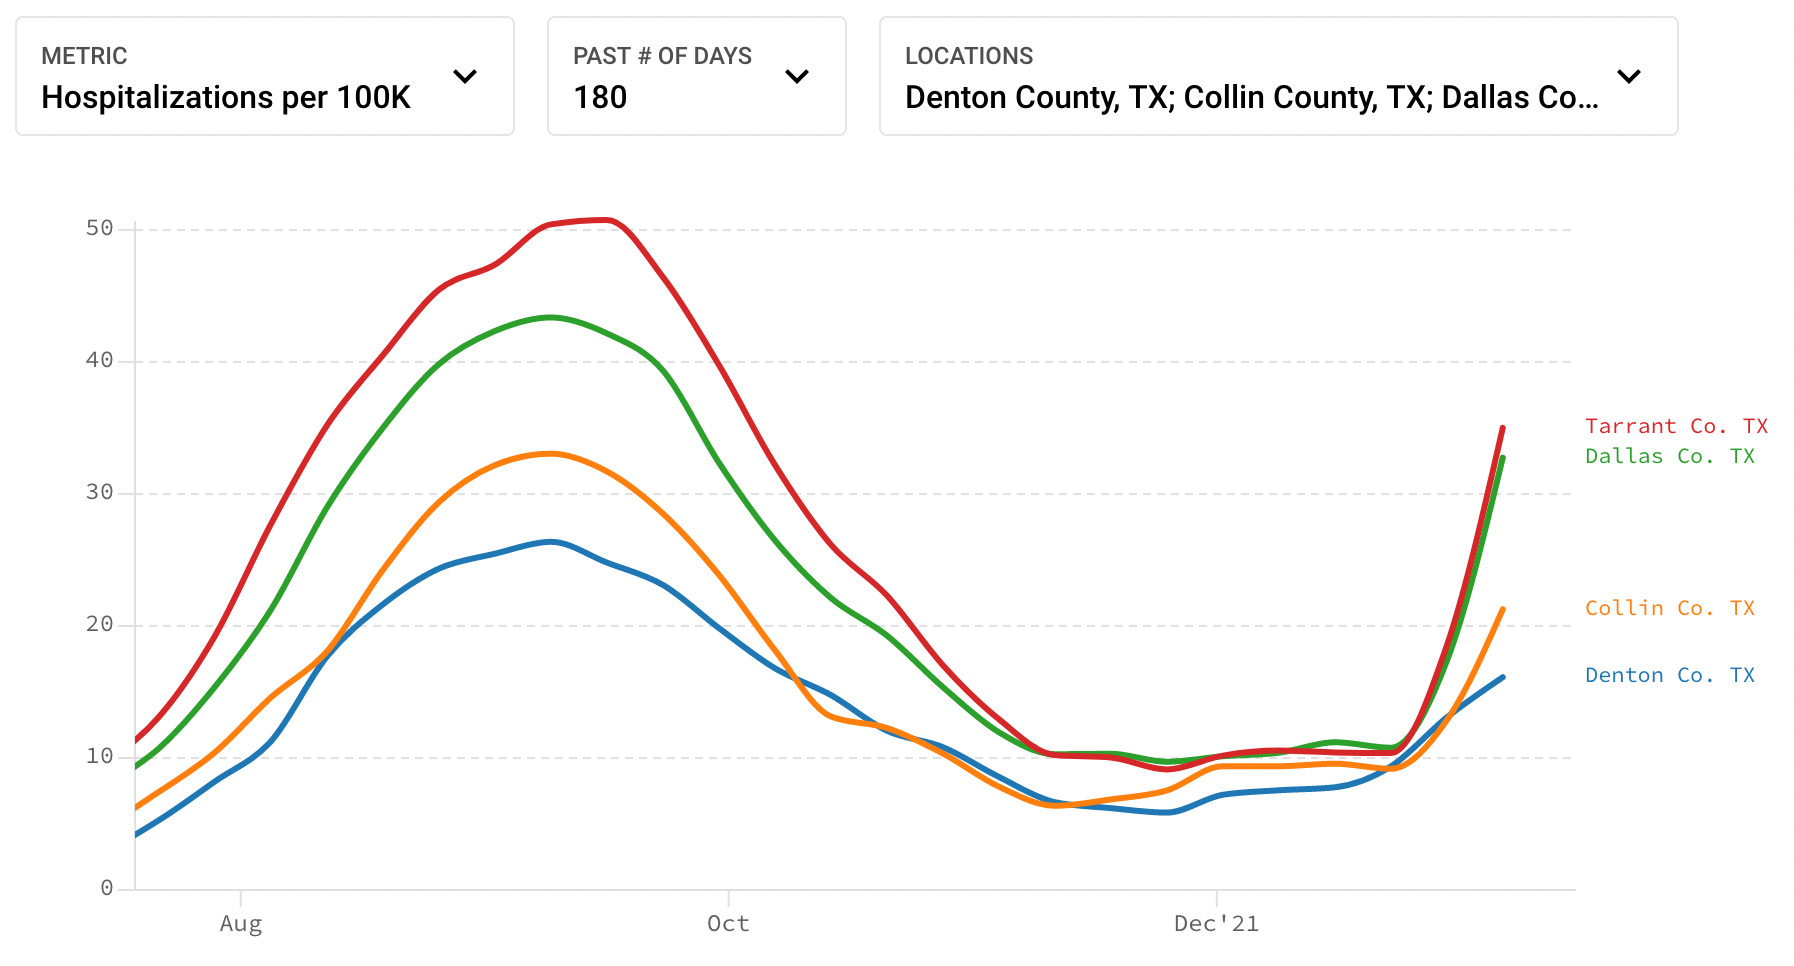
The last and sixth graph shows the per 100K hospitalization trends in the four most populous counties of the DFW Metroplex. You can see that hospitalizations are increasing in all four counties, in the case of Dallas and Tarrant Counties, increasing at a rate faster than what was the case during the Delta surge in September. This is concerning for those of us in the suburbs and outlying communities of DFW as the main tertiary care facilities of the Metroplex are in Dallas and in Fort Worth.
The hospitalization data is about 8 days old due to reporting lags but the trends are quite apparent that the continued trajectory will further strain medical care resources in the area. Checking other data sources, the hospitalization levels in Texas have now exceeded what we experienced during the Delta surge in September and are now set to exceed the prior high water mark set during the Alpha surge last winter. UT Southwestern's own modeling data suggests we will easily surpass prior hospitalization surges for COVID significantly in the next several weeks. Hospital and critical care utilization could easily be double what it was last winter during the Alpha surge in the next several weeks.
Last night I posted "Ten Thoughts" on the pandemic that I won't repeat tonight but are worth reading again and sharing with others who are worried about the current state of affairs:
As a parent and a physician, I cannot envision not doing everything possible to protect your own children. But then again, I never envisioned a day where political ideologies would so profoundly shape public health policy.
I never envisioned that so many would be so comfortable with the death of nearly 850,000 Americans.
I never envisioned that so many would refuse the most effective of preventive measures against significant disease, hospitalization and death.
I never envisioned that a health care system of the most prosperous nation on this planet would be strained to the levels that we are seeing today.
I never envisioned that so many would readily dismiss the scholarship and expertise of people who have spent their careers in science, medicine, and epidemiology.
But here we are.