
PEDIATRIC COVID TRENDS, DENTON COUNTY, 10/9/21
PEDIATRIC COVID TRENDS, DENTON COUNTY, 10/9/21
Signs of improvement but overall levels are still higher than what would be considered "safe" levels of community transmission

This is a set of graphs from data I have been tracking pediatric COVID cases from information released each weekday from the Denton County Health Department. Let’s run through each graph:

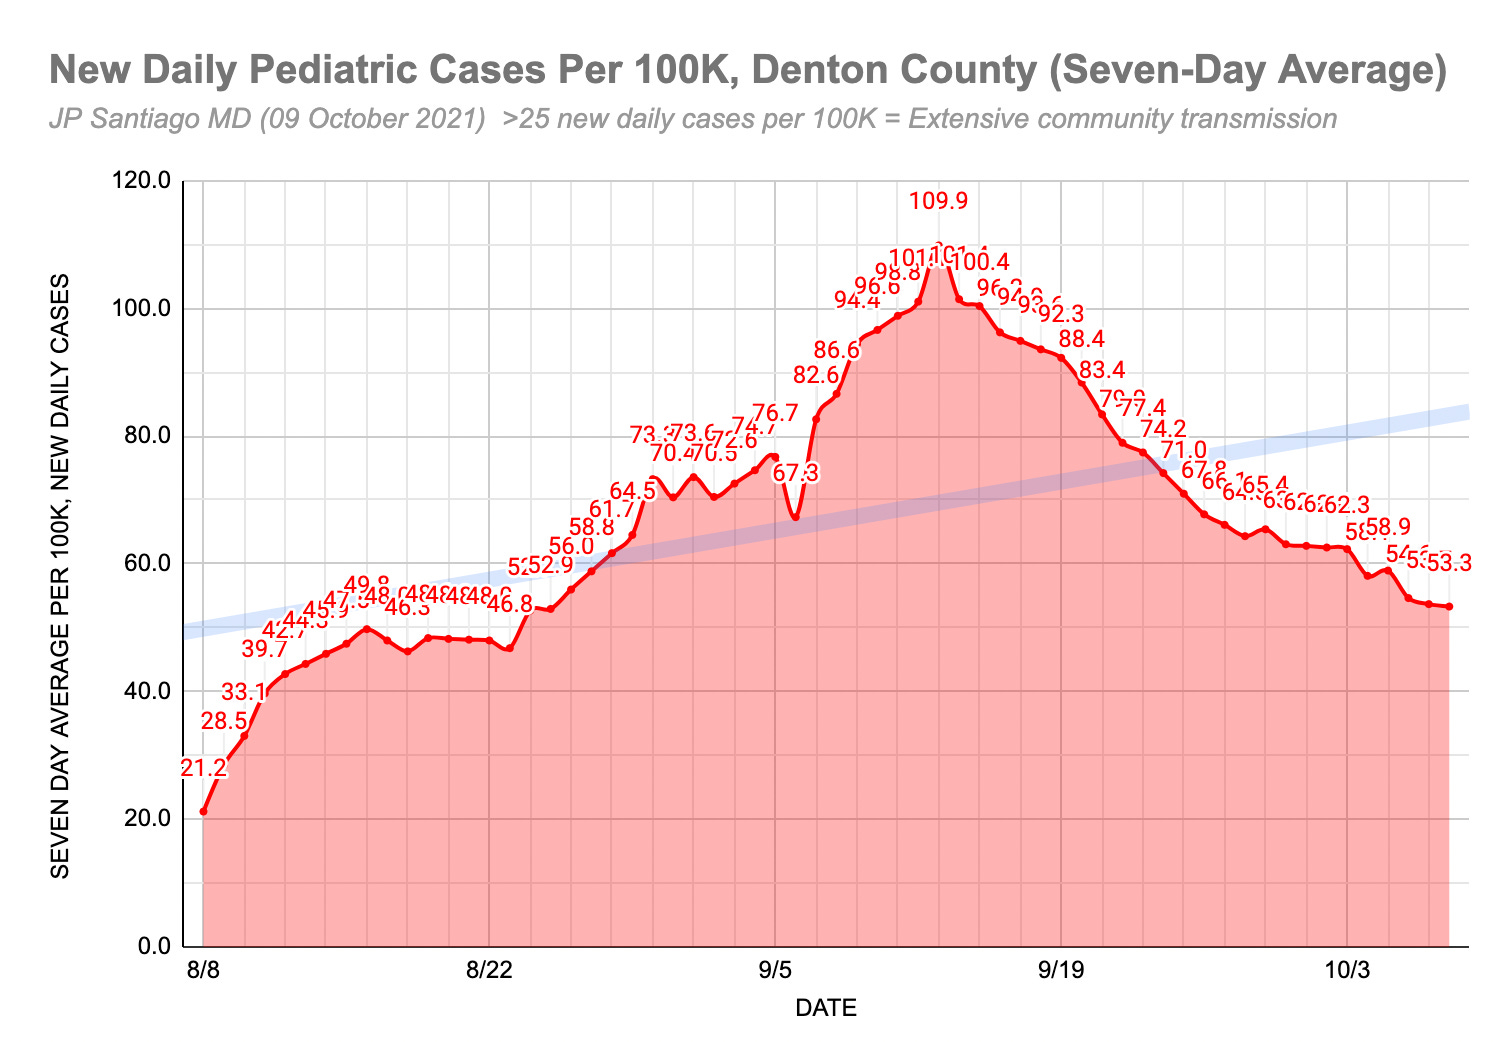
This graph plots the seven-day average of new pediatric COVID cases in Denton County. I have also included data for context reflecting the numbers released on Friday afternoon, 08 October 2021.
Take home points from this graph:
1/ Daily numbers have improved significantly since the peak a month ago.
2/ There are appears to be the potential of a slowing of the trends in improvement in the last week. I cannot tell as of yet if this is a plateau and things will go up or if this will be an ongoing background rate of COVID in those 19 and younger in Denton County.
3/ Those 19 and younger are still bearing a higher case burden (51.9 per 100K this past Friday) compared to all ages across Denton County (33.3 new daily cases per 100K).
4/ County test positive rates remain above 10%, indicating that current testing rates are insufficient to catch all positive cases and test their close contacts.
5/ The fully vaccinated rate in Denton County has been slowly increasing at a rate of about 0.1% per day.
This graph is the same data pas the previous graph, only this time I’ve calculated the new daily cases per 100,000 using the pediatric population of Denton County as it’s own population. Of the 906,422 people of Denton County, approximately 26% are ages 19 and younger- or approximately 225,615.
Incidence per 100,000 is a standard expression that allows us to compare cases amongst different sized populations instead of using absolute case numbers.
Take home points from this second graph:
1/ New daily cases >25 per 100,000 are considered highly indicative of extensive community spread. In the pediatric population of Denton County, new COVID cases in children have been at that level since early August.
2/ The ideal number of new cases per 100,000 that would be considered a safer environment for children per the COVID-19 Policy Lab at Children’s Hospital of Philadelphia would be <5 new daily case per 100,000.
3/ Like the first graph, we are seeing the possibility of a plateau in the coming weeks. As to whether that will increase or decrease, it is too early to tell.

This third graph just looks at the numbers of total weekly new cases in Denton County. Again using Children’s Hospital of Philadelphia’s criteria, anything >100 new daily cases per 100,000 is considered critical. Safe levels from their COVID-19 Policy Lab would be less than 10 new COVID cases per 100,000 per week.
For Denton County, that means less than 23 new cases per week would be considered a safe level of COVID in the community for children. Anything over 226 new cases per week in children is considered critical.
You can see that even with the decline in pediatric COVID cases in the last several weeks, we are about three times higher than that critical threshold.
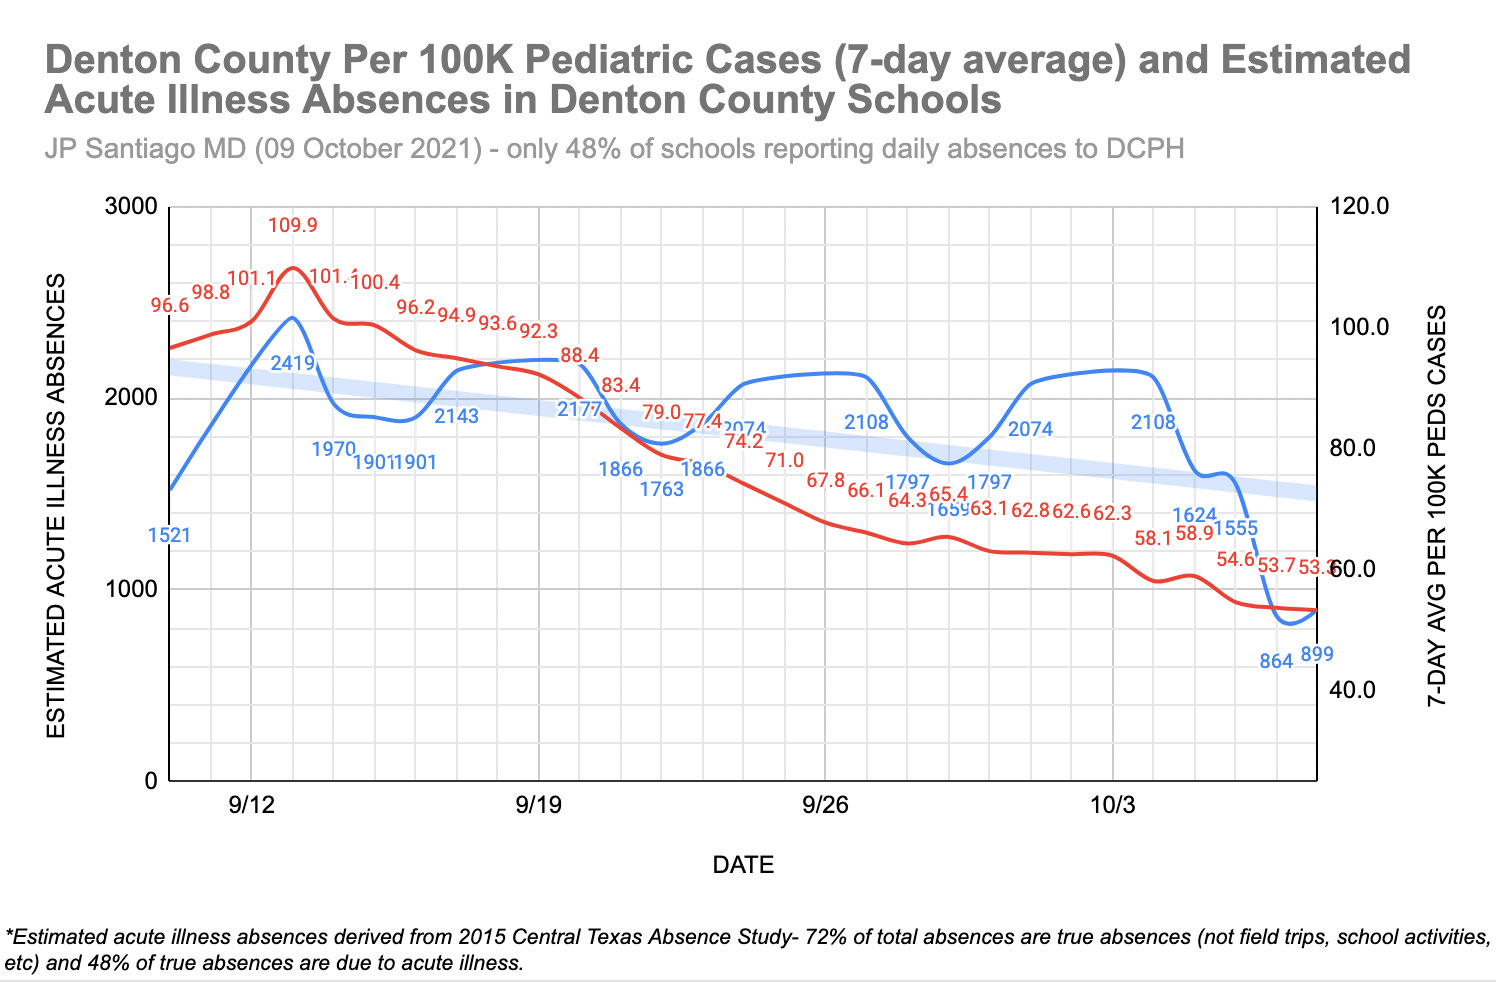
Here I have plotted the seven-day average of pediatric COVID cases per 100,000 people against the estimated acute illness absences in Denton County public schools- not all schools are reporting but it’s a durable parameter that’s not dependent on COVID testing or parent/guardian disclosure which is how current local school districts are reporting their COVID cases.
I used the 2015 Central Texas Absence Study as a basis to estimated acute illness absences. In their study, about 72% of total absences are true absences (that is, not field trips, school activities, or a parent/guardian issue) and of those true absences, 48% are usually due to acute illness.
Given that most symptoms of acute pediatric illness are usually upper respiratory tract symptoms or gastrointestinal symptoms and that those are both sets of symptoms that are common in COVID, acute illness absences are a potential data stream to watch that is not reliant on testing and/or parent or guardian disclosure of a COVID-positive child.
Take home points to note in this fourth graph:
1/ Estimated acute illnesses remained fairly constant despite decreases in county-wide pediatric COVID cases. We know from multiple studies that children by and large are undertested compared to adults, so it may be that the decreases in official case numbers in those 19 and under in our county may not fully reflect the full extent of COVID positive children in our community.
2/ The plateaus in each week are the weekends. Each week follows the same pattern, the lowest number of estimated acute illness absences are usually in the middle of the week, with the start of each school week and end of each school week usually the highest. Monday numbers may be due to weekend off-campus exposures and Friday numbers may be due to on-campus exposures. Given the lack of mask mandates at most if not all school districts in Denton County, I would expect to see this sort of trend and this is what is typically seen.
So what is the bottom line? Are things getting bettter?
Yes.
But we are not at community prevalence levels that give school districts and their school boards a pass for not having mask mandates and better pandemic mitigation protocols in place.
So that’s a yes with a big asterisk.
Even though the rates of critical illness in children with COVID are much less than that of adults, it’s not zero. Hospitalizations rates from states that are collecting more detailed data than the State of Texas suggest that the hospitalization rate is about 1%.
And that’s a small fraction and by and large encouraging. But let’s look at it this way:
Let's put 1000 students from grades K through 12 in the gym.
Each day, between 10 and 35 of them are selected to get COVID.
Of the kids each day who get COVID, between 2 and 5 of them will have to deal with COVID symptoms for the next six months ranging from fatigue and shortness of breath to varying degrees of cognitive impacts.
For every 100 kids who get COVID, one of them is selected to get hospitalized for COVID.
In the absence of a mask mandate along with capacity restrictions and limits on indoor activities, this is the lottery that has been going in our schools each day since the start of school.
Our school districts, their school boards, and their district leadership have been playing a high stakes game gambling that they could do as little as possible and not end up with a student or staff member in the hospital or worse, dead from COVID.
Each day of this Delta variant surge, that gamble is played with the lives of our children and their teachers.
As a parent and physician, I can’t see how that is even remotely morally acceptable.