
SCHOOLS AND COVID: DENTON COUNTY
SCHOOLS AND COVID: DENTON COUNTY
Are there insights to be gained from reviewing last school year's COVID data?

"There are zero ICU beds left for children. That means if your child's in a car wreck, if your child has a congenital heart defect or something and needs an ICU bed, or more likely if they have Covid and need an ICU bed, we don't have one. Your child will wait for another child to die. Your child will just not get on the ventilator, your child will be CareFlighted to Temple or Oklahoma City or wherever we can find them a bed, but they won't be getting one here unless one clears."
-Dallas County Judge Clay Jenkins, 13 August 2021
High resolution version of today's pandemic graphic:
https://drive.google.com/file/d/1Vj1y1A_tLCLzInHBWJ4ZBJIehkyywOzK/view?usp=sharing
BACKGROUND
Back in February I did a posting that compared the COVID cases among the in-person students of Lewisville ISD (my home district), the population of Denton County under 18, and all Denton County residents.
Link to that prior post: https://www.facebook.com/jp.j.santiago/posts/10218299165367477
In that February posting, I showed how the prevalence per 100K people in the students participating in in-person learning mirrored that of the general pediatric population of Denton County which in turn mirrored case trends among the entire population of Denton County across all ages.
This is something we saw last year with cases among health care workers, that overall trends tended to be reflective of COVID prevalence in their home communities.
With the 2021-2022 school year off to a contentious start not just in my own home school district of Lewisville ISD but also across Texas, I thought it would be instructive to revisit my prior post and see what insights it might offer for what we can expect for the next several weeks of the new school year.
DATA SOURCES
The data for today's post comes from three sources- Lewisville ISD's own COVID tracking page, the COVID dashboard for the Denton County Public Health Department, and from Carnegie Mellon University's Delphi Project which runs their COVIDcast pandemic data aggregation site. I also pulled variant prevalence data for the State of Texas from the outbreak.info site which is a multi-institutional consortium led by the Scripps Institute. Finally we'll validate data trends by using some of the social media survey work from the CMU Delphi Project.
POPULATION NUMBERS
There are four population numbers were going to use in today's discussion:
Number of Lewisville ISD students doing in-person and virtual plus learning in the 2020-2021 school year: 35,351
Number of Denton County residents under the age of 19: 214, 541 (about 24% of the total county population).
Total population of Denton County: 887, 207 (2019 data- seventh most populous county in Texas)
Estimated number of adult Facebook users in Denton County: 470,166
COVID CASE LOAD COMPARISONS
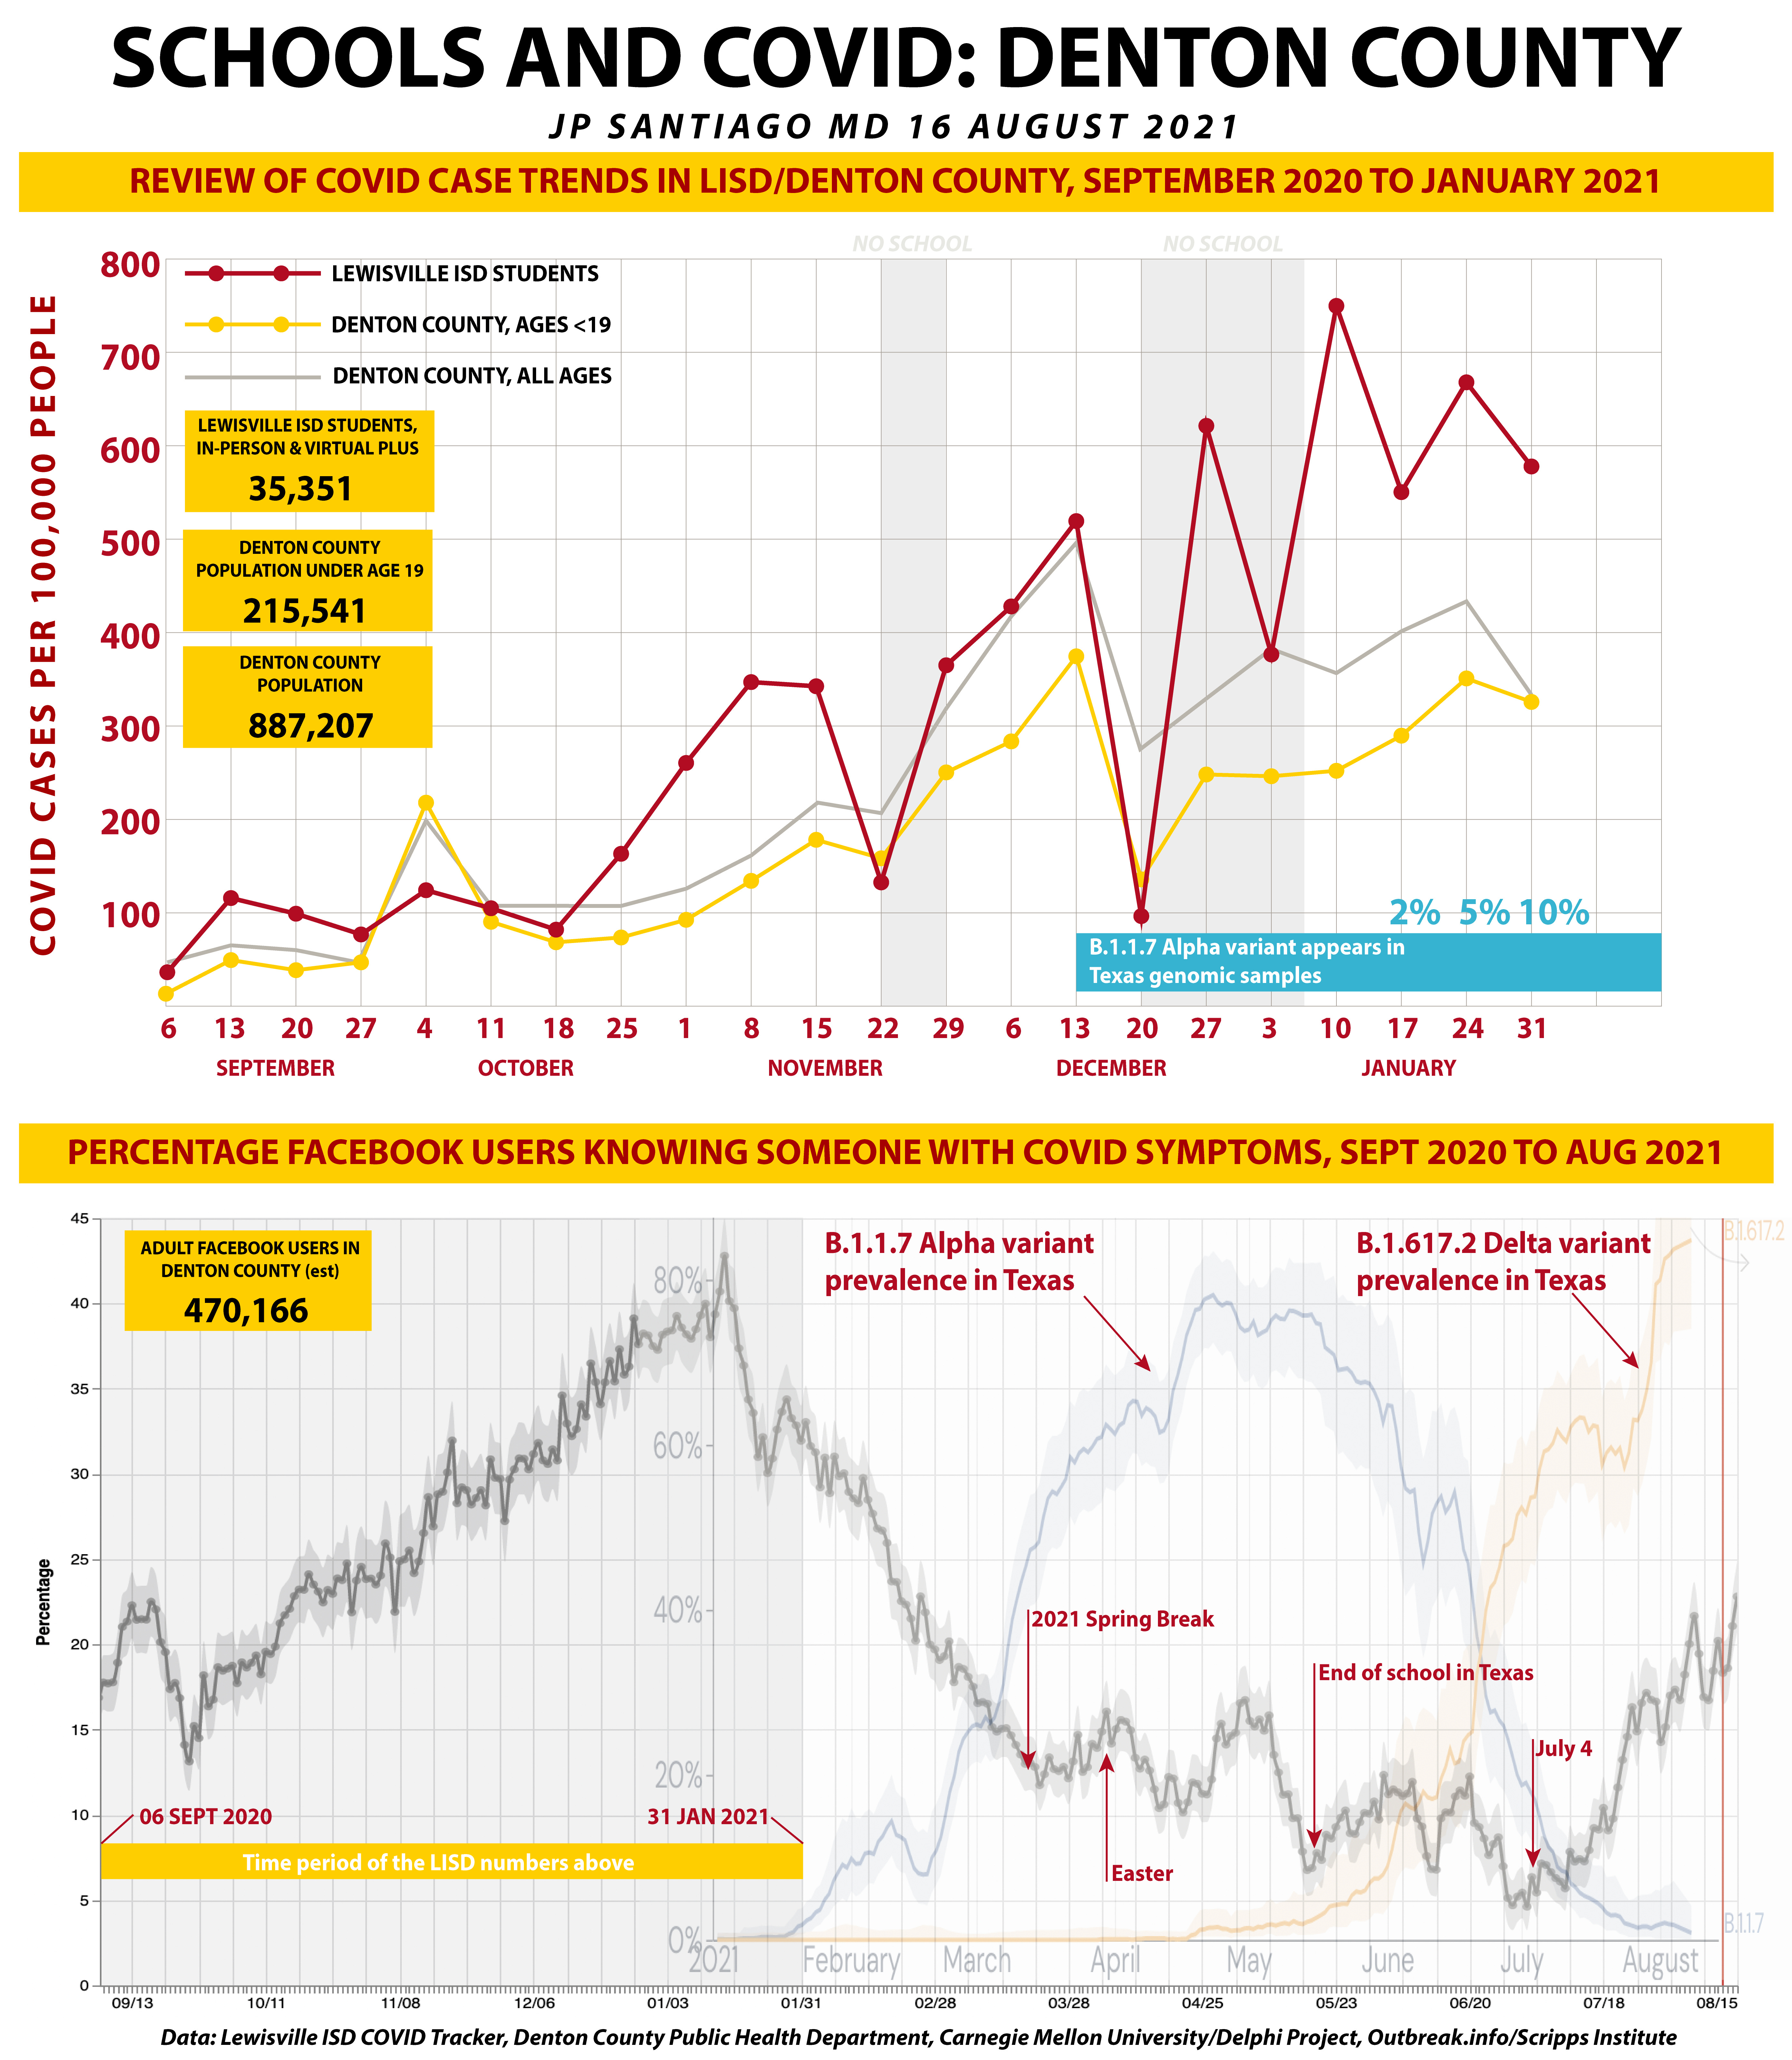
What I did with the upper graph was to treat the in-person/virtual plus student numbers from last school year as its own community and calculate based on released data each week the COVID case prevalence per 100,000 people. I did the same thing for the population of Denton County under the age of 19 as well as the population of Denton County as a whole.
By normalizing the population to COVID cases per 100,000 people, it allows for a better comparison of the prevalence of COVID in each group- students doing in-person learning, those under 19 in Denton County, and all age groups in Denton County.
The absolute number of COVID case numbers doesn't give the right sense of a community's COVID burden as the per 100K number which allows better comparisons between different groups.
HOW DO WE ASSESS SCHOOL RISK?
To keep things simple, I like to use the four-tiered system used by the COVID Policy Lab at Children's Hospital of Philadelphia:
LOW RISK: <10 cases/100K/week
MODERATE RISK: 10-35 cases/100K/week
ELEVATED RISK: 35 -100 case/100K/week
DANGEROUS RISK: >100 cases/100K/week
LOOKING AT THE DATA
The main graph I have plotted the cases per 100K for the LISD in-person/virtual plus student population, that for all Denton County residents under the age of 19, and the total cases per week per 100K for all residents of Denton County. The vertical gray bars mark out Thanksgiving break and the Christmas/New Years' break as well.
I have also added when the first of the significant COVID variants enters the picture- B.1.1.7, the Alpha variant, was first detected in Texas approximately around 13 December- that is the blue bar in the lower right of the upper graph.
I have also noted the Alpha variant's prevalence in Texas samples in the time frame that I analyzed LISD's data- 2% prevalence on 17 January, 5% prevalence on 24 January and 10% prevalence on 31 January.
Things to note in the main graph:
1/ Since the end of September 2020, Denton County experienced high COVID transmission in the community, >100 total weekly cases per 100K.
2/ Trends for those in Denton County under the age of 19 getting COVID track along with the trends for residents of all ages in Denton County.
3/ COVID trends in Lewisville ISD in-person and virtual plus students follow the general trends for both those under 19 in Denton County and for all ages in Denton County but at a higher prevalence level for most points in time.
4/ Substantial case increases occurring immediately after Thanksgiving and Christmas/New Years' breaks point to substantial exposure risks during those school holidays.
5/ Case prevalence in all three groups was increasing before the detection of B.1.1.7 Alpha. It is possible that Alpha was present in the community sooner as the sequencing effort in the United States was not yet spooled up to the volume and bandwidth that it is now. It is definitely possible that the Alpha variant drove part of the holiday surge we had here in Texas.
LIMITATIONS IN THIS DATA FROM LEWISVILLE ISD
The case numbers reported by Lewisville ISD last school year are dependent upon parent reporting of positive cases. If anything, there is the possibility of under counts in the cases as I have gotten plenty of anecdotal information passed on to me privately about families and students not reporting COVID positive results out of a desire to not get pulled out of athletic and other school activities.
If we do consider the possibility of under counting of cases amongst Lewisville ISD students, we would be dealing with a serious issue that may be amplifying community spread in activities at the school, both last year and this year.
SOCIAL MEDIA SURVEYS
In the past I have used the data from Carnegie Mellon University's Delphi Project that uses social media surveys as a way of gaining additional insights into the pandemic environment. I personally have done three such surveys which are done in cooperation with Facebook. They have been running the survey project with Facebook's help since April 2020 and about 50,000 to 60,000 survey responses come in each day.
As the survey asks your zip code, survey results can be localized to specific counties. The survey questions are also very specific in terms of symptoms, so there's not a whole lot of room to misinterpret the questions.
This second graph comes from the Delphi Project's COVIDcast website and is the percentage of survey results from Denton County that report knowing someone with COVID symptoms. The graph covers the period from 06 September to now.
The area covered by my analysis of LISD's COVID data is highlighted in light gray on the left side of the lower graph.
You can clearly see that the trends from social media survey results from Facebook users in Denton County do track along with the overall case numbers in the main graph. By looking at a second, distinct source of pandemic data, it provides insight and validation to the school data in the main graph.
Beyond the analysis period running 06 September 2020 to 31 January 2021, I have superimposed variant prevalence data for the State of Texas for both B.1.1.7, the Alpha variant, and B.1.617.2, the Delta variant, and scaled the graph so their time scales line up.
I have noted in the social media survey data major points that cause changes in public behavior- most notably, 2021 Spring Break, Easter weekend, the end of the 2020-21 school year in Texas, and July 4 weekend.
I have shown in the past that case numbers tend to increase in the 1-2 weeks following a change in public behavior, like holidays. We see the same trends in social media survey reporting, so it has been a useful surrogate marker for case numbers in a lot of situations.
Note the two mini-peaks in April and May that coincide with the peak of Alpha variant prevalence in Texas. This was a time period where the vaccination rates were increasing rapidly and the schools still had full pandemic mitigation measures in place which include mask mandates. That served well to blunt the impact of the Alpha variant in Texas.
The Alpha variant had a mutation called N501Y that made it more contagious but it did not seem to give it an advantage against the countermeasures we had in place this past spring.
Delta, on the other hand, is significantly more contagious and clearly an airborne pathogen and it also possesses mutations that give it some degree of immune escape where it can dampen our immune response. This can result in worse illness, something we are seeing in the data now- children infected with the Delta variant have a 2.75 times higher risk of hospitalization and across adults, we are seeing a greater fraction of those hospitalized needing ICU care.
The Delta variant's immune escape mutations also reduce the effectiveness of the vaccines. Vaccination to prevent COVID hospitalization and death, though, is still outstanding. The vast majority of those hospitalized now and those dying now, are the unvaccinated.
Note Delta's prevalence trajectory this summer and it has yet to show any signs of peaking. We are seeing in the epidemiological data that with the start of school, the mutations of the Delta variant are affecting children to a far greater degree than the original "wild type" virus did last year.
LET'S TALK ABOUT TEACHER AND STAFF RISKS, IT GETS LOST IN THE DISCUSSION OF RISKS TO STUDENTS
In assessing teacher risks, there are five factors to take into consideration:
1/ School funding- are funds readily available to pay for mitigation measures like masks, hand sanitizer, shielding where needed and improvements to ventilation and HVAC systems?
2/ Overcrowding- this impacts capacity restrictions and social distancing in the schools. Are there a lot of students in each classroom? How do the hallways look between classes? The cafeteria during lunch? Sporting events, pep rallies, meetings- are those taking place and where?
3/ Health care access- do teachers have access to health care and good quality benefits to address medical conditions that put them at higher risk? Do they have wage protections and sick leave to see their physicians not just for any ongoing medical issues but to get tested and evaluated for COVID?
4/ Leadership- do decision makers at the individual school level and district level prioritize pandemic mitigation response? Is there consistent messaging to both staff and students on the need to adhere to pandemic response? Is it taken seriously and do school leaders act as role models in their schools and communities in taking the pandemic seriously?
5/ Community COVID burden- what is the extent of COVID in the community? Given that exposures outside of the school present the greatest threat to both teachers, ancillary staff and students, what is done in the community by everyone from the individual to households to businesses to elected officials will have the most impact on protecting the teachers and their students.
BOTTOM LINE, SO WHAT WILL THE NEXT SEVERAL WEEKS LOOK LIKE?
1/ Expect rapid increase in school cases to mirror the rapid increase in community cases we are seeing now. Averaged over the last 7 days, Denton County is at 26.4 cases per 100K/day. Anything over 25 cases/100K is considered extensive unchecked community spread by UT Houston School of Public Health's criteria. Our weekly case load is 104.6/100K/week, which puts us in the dangerous risk category by Children's Hospital of Philadelphia's criteria.
2/ Any school district lacking a mask mandate will be facing large numbers of staff and students in quarantine, a significant number of staff and students likely symptomatic with infection. School districts across the United States that have been in session for the last three weeks are experiencing disruptions and closures due to lack of pandemic mitigation protocols.
3/ School districts will likely be faced with a temporary shut down of the entire district (and have to use banked bad weather days). I would anticipate that individual classes might be suspended first, then grade levels, then individual schools. The climate is such that a full district closure would be a last resort.
4/ Absent virtual learning options for students in quarantine, school districts like LISD would be faced with the prospect of large numbers of students not meeting attendance requirements. There's going to be a lot of very upset families across the board in the next several weeks.
5/ Teachers and staff, particularly those who are not vaccinated, are at very high risk, more so than the children in their classrooms. Adult risks, morbidity and mortality in adults with Delta infection are serious, more serious than what we faced with COVID infection in adults last year.
PARTING THOUGHTS
What will likely happen here in the next several weeks is guided by what is already happening in other school districts that started classes without proper pandemic mitigation protocols. At the bare minimum, a mask mandate is necessary. Many did not even have that and are now facing widespread disruption of the school year.
The virus didn't cause the disruptions.
That's the result of misguided, misinformed planning and decision-making from the district level to the state level. This is all predictable and preventable. Particularly now that we have vaccines down to the age of 12.
Bad decisions caused the disruptions.
Think back at the challenges we faced during the winter surge. That was with a less contagious virus (the original virus and the Alpha variant) than Delta. And that was with full pandemic mitigation protocols in place including mask mandates.
Now what do we have?
A highly contagious airborne variant, Delta. Little to no pandemic mitigation protocols like mask mandates, capacity restrictions and social distancing.
If this story ends a different way, I'm all ears.
Until then, we are all stuck waiting for a hurricane of pathogenic potential to make landfall.
PAST PANDEMIC POSTS
TEXAS HOSPITALIZATION UPDATE (12 August 2021):
https://www.facebook.com/jp.j.santiago/posts/10219315088404918
WHEN POLITICS IS MORE IMPORTANT THAN LIVES (12 August 2021):
https://www.facebook.com/jp.j.santiago/posts/10219314135261090
RESOLUTE ACTION IS NEEDED NOW (11 August 2021):
https://www.facebook.com/jp.j.santiago/posts/10219307334851084
OH YEAH, HE DEFINITELY SAID IT (10 August 2021):
https://www.facebook.com/jp.j.santiago/videos/532381177877817/
HE SAID WHAT? (09 August 2021):
https://www.facebook.com/jp.j.santiago/posts/10219302093640057
QUICK UPDATE: TEXAS ACADEMY OF FAMILY PHYSICIANS STATEMENT (09 August 2021):
https://www.facebook.com/jp.j.santiago/posts/10219299843863814
TEXAS HOSPITALIZATION CRISIS POINT (07 August 2021):
https://www.facebook.com/jp.j.santiago/posts/10219292575242103
SCHOOLS AND COVID RISK: DFW METROPLEX (06 August 2021):
https://www.facebook.com/jp.j.santiago/posts/10219288099490212
COVID TRENDS: TEXAS (03 August 2021):
https://www.facebook.com/jp.j.santiago/posts/10219275998347691