
SCHOOLS AND COVID RISK: DFW METROPLEX
SCHOOLS AND COVID RISK: DFW METROPLEX
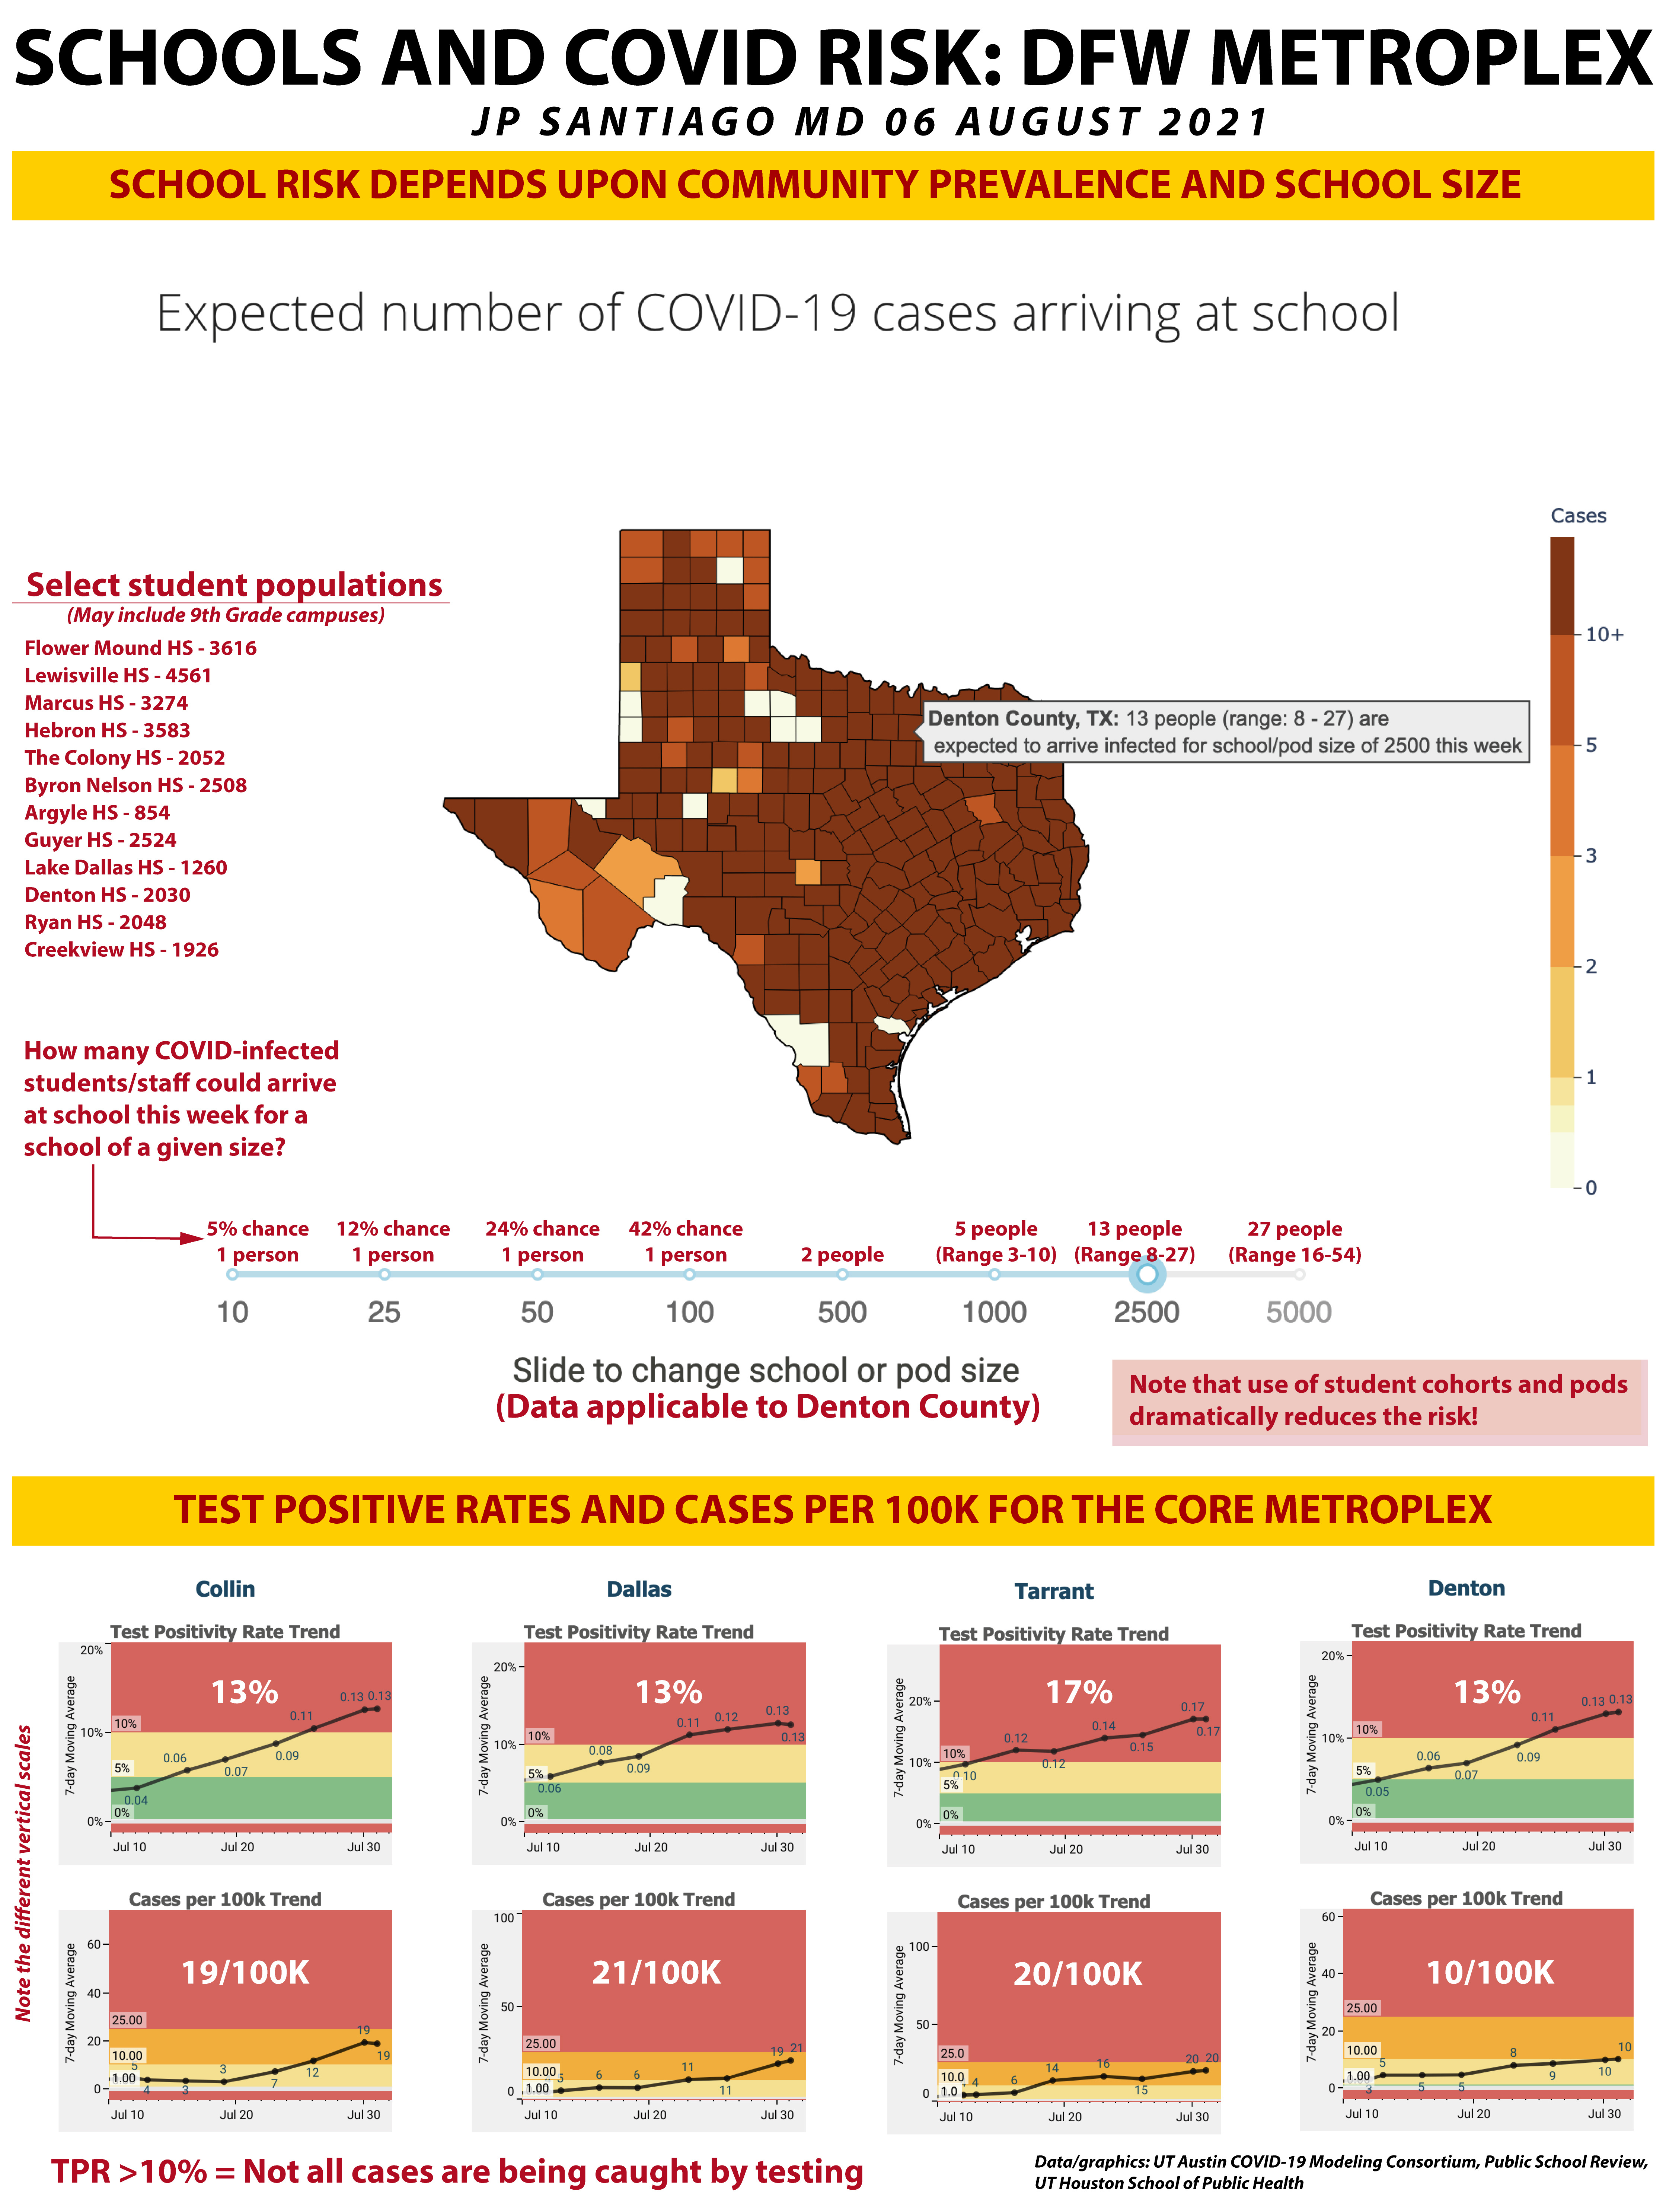
School risks depend upon community prevalence and school size. Mitigation measures offset that risk.

“The AAP recommends universal masking in school at this time for the following reasons:
a significant portion of the student population is not eligible for vaccination
protection of unvaccinated students from COVID-19 and to reduce transmission
lack of a system to monitor vaccine status among students, teachers and staff
potential difficulty in monitoring or enforcing mask policies for those who are not vaccinated; in the absence of schools being able to conduct this monitoring, universal masking is the best and most effective strategy to create consisent messages, expectations, enforcement, and compliance without the added burden of needing to monitor vaccination status
possibility of low vaccination uptake within the surrounding school community
continued concerns for variants that are more easily spread among children, adolescents, and adults”
-American Academy of Pediatrics COVID-19 guidance
High resolution version of today’s graphic:
https://drive.google.com/file/d/1cSDVP7W1HaveNT2B4ZNkl3mggbraZIg_/view?usp=drivesdk
BACKGROUND
As hospitals across the state of Texas are straining to handle the increases in COVID hospitalizations, school is starting throughout the state with some school districts starting this past week and most districts starting next week. Few of them have pandemic mitigation measures in place. This has been a contentious point in community discussions with fault lines often drawn based on political affiliation which has been a recurring and often tragic theme in this pandemic.
Recently issued guidance on COVID-19 issued by the Texas Education Agency unfortunately has not been reflective of the current science of the pandemic, particularly in light of the rise of B.1.617.2, the Delta variant.
As has been a recurrent theme in my posts and supported by the scientific and epidemiological data so far, the pandemic in 2021 is a different ballgame than what we endured last year. The Delta variant is much more contagious (about 2x that of last year’s virus) and clearly an airborne pathogen. Data just released shows that viral loads are identical early in the course of infection in those vaccinated versus those unvaccinated, but that the primed immune systems of those vaccinated prevent serious illness, hospitalization and death.
There are key mutations in the spike protein of the Delta variant that offset the natural advantages that children have had in the past pandemic last year when it appeared that they were in large part, spared the burdens of the pandemic.
That is no longer the case with the Delta variant.
Pediatric hospitalizations are increasing nationwide out of proportion to the increase in cases and the start of school in Texas has many in the medical and scientific community outright scared of what is to come in our communities in the next four to six weeks.
DATA SOURCES FOR TODAY
The top half of the graphic comes from the University of Texas COVID-19 Modeling Consortium that has a school risk calculator based on location and school size. You can check it out for yourself here: https://covid-19.tacc.utexas.edu/dashboards/school-risk/
I have included the student body sizes for a selection of high schools in Denton County, the numbers come from Public School Review: www.publicschoolreview.com. Be aware that these numbers also include the 9th Grade campuses that some high schools have that are separate facilities from the main high school. But the overall risk based on student body size would be not much different given that some 9th grade students attend classes at the main campus and that risks are still identifiable for a 9th grade campus based on its own student body size.
Also keep in mind that those high school numbers do not include the teachers and staff also present.
The lower half of today’s graphic comes from the pandemic dashboard for the University of Texas Houston School of Public Health, www.texaspandemic.org. While the DFW Metroplex encompasses 13 counties, I have included the data for the four most populous counties of the DFW area: Dallas County (2.6 million), Tarrant County (2.1 million), Collin County (1 million), and Denton County (887,000). Do note that the vertical scale for each county is slightly different to scale for the data presented.
SCHOOL RISK DEPENDS UPON COMMUNITY PREVALENCE AND SCHOOL SIZE
On the UT Austin COVID-19 Modeling Consortium’s site, you can move a slider to different school sizes and then over over each county to determine the number of people (students and staff) that would be infected with COVID-19 at each school this week. As community prevalence data changes, that number changes.
High community prevalence (estimated via a combination of test positive rates and cases per 100K residents) increases the number of potentially infected students and staff showing up for a given school size.
What I have done above the slider is show the number of cases expected to show up at school for a given size. Note that school sizes under 500, the chances are only 1 person infected may show up and those chances decrease with smaller sizes.
For schools 500 or higher present on campus, the scale transitions from chances of one person showing up infected to numbers of people who are infected. Remember, bigger groups = increased risks. I have also included the range predicted by UT Austin’s modeling data. So for a school with 2500 people present on campus, the estimate is for 13 people showing up this week infected with COVID, but the modeling data has a range that that number could be as low as 8 to as high as 27 based on the confidence intervals.
Over the right of the Texas map I have the student body sizes for a selection of high schools in Denton County that cover Lewisville ISD, Argyle ISD, Roanoke ISD, Lake Dallas ISD, Denton ISD, and Carrollton ISD. It is *not* a complete list of all the high schools in Denton County.
Approximately 25% of the 887,000 residents of Denton County are under the age of 18.
Given that risks decrease with smaller groups, this is a great illustration on the benefits of using student cohorts and pods in schools, something I have advocated for in my own discussions regarding our own local school district. Combined with universal mask use and capacity restrictions, use of student cohorts and pods can help greatly in mitigating the impact of the Delta variant.
TEST POSITIVE RATES AND CASES PER 100K RESIDENTS IN THE CORE METROPLEX
While the benchmark used by the UT Houston School of Public Health is that >25 cases per 100,000 residents is consistent with extensive community spread of COVID, you will note that in each of the four most populous counties of the DFW Metroplex, the cases per 100K is under 25/100K.
However, as I have often posted in the past, pandemic analysis cannot rely on just a single parameter, so I have also included data on the test positive rate for each of the four counties.
A REVIEW OF TEST POSITIVE RATES
The red area is the >10% daily positive test rate. You don’t want to be above this line. The daily positive test rate doesn’t hinge on the number of tests done. While it is not an independent or durable data trend like hospitalizations or percent physician visits for COVID symptoms, it’s a very useful parameter to gauge pace of pandemic spread in a given population.
If testing is increasing and the pandemic in a given area is slowing down or easing, then the positive rate will drop. More tests, less people sick, lower positive rate. This is the most ideal situation right now to be in. Anyplace with a daily positive rate under 5% is in good shape in terms of extent of community spread.
If testing is increasing and the pandemic in a community is spreading at a rate that matches testing rates, then the positive rate levels out. More testing is equal to more cases, so the positive rate stays the same.
If testing is increasing and the pandemic in the community is spreading at a rate faster than the increase in testing, then the positive rate increases. The benchmark is 10%- with a daily positive rate of 10% or less, you are *likely* to catch most of your COVID cases. 10% is not ideal- usually at 5% or less, we can be sure that not only are we catching all the COVID cases but we’re also testing their close contacts.
At a daily positive rate of 10% or higher, extensive community spread is taking place and the pandemic is overwhelming the testing infrastructure. That is precisely what we are seeing in the four most populous counties of the DFW Metroplex.
CASES ARE NOT NECESSARILY THE BEST MEASURE
In the past we have relied on case numbers to help estimate the community burden of COVID infection. They are still an important measure in this pandemic but should NEVER be used alone in determining courses of action. This is why we look at other parameters like test positive rates, percent physician visits for COVID, even social media survey results which I have shown in the past can be useful.
The presence of a vaccinated fraction in a community also affects things. Those infected may not be symptomatic or have illness so mild that don’t seek medical attention or testing which can lead to lower than actual number of infected in the community.
Given that the vaccine design endpoints were the prevention of hospitalization and death and not prevention of infection and transmission, having vaccinated individuals test positive is to be expected. I don’t like the term “breakthrough infection” because blocking infection is not a function that was part of the vaccine design.
It is important to know the numbers of vaccinated positives and unvaccinated positives, though. By virtue of how our immune system works, being vaccinated reduces the chances of infection and being contagious, but not to the degree that they prevent hospitalization and death from COVID. The data across the nation are clear that those unvaccinated are most at risk and Delta presents a clear and present danger to those not vaccinated. Vaccination is not a free pass and the most recent data shows that to be the case- again, this is not unexpected and a more detailed review of why that is will be the subject of an upcoming post from me.
TAKE HOME MESSAGES
1/ The Delta variant and its epidemiological and clinical behavior overturns assumptions about pediatric infections that we had last year. Delta is a clear threat to children, particularly those who are too young to be vaccinated.
2/ The risks of COVID morbidity in adolescents are close to that of adults and this is of particular concern in the high school population that is eligible for vaccination. The risks of adverse vaccine side effects like myocarditis are near insignificant compared to the risks of COVID-induced myocarditis and COVID long haul syndrome.
3/ Delta is clearly more contagious and airborne. Lack of mask mandates are a recipe for disaster in our schools.
4/ During the holiday surge that was driven by B.1.1.7 Alpha, there were still quite a few students out for quarantine/isolation along with staff. And *that* was with a mask mandate, remote/virtual options for students and other pandemic mitigation measures in place. And we had periods where the ICU bed availability in the DFW area was tallied in single digits. Now we have a more contagious variant, B.1.617.2 Delta, that is been shown to be airborne as well and the schools in Texas by and large with few exceptions lack any pandemic mitigation measures. What do you think will happen once all the school districts are in session?
5/ UT Austin’s data shows that using student cohorts/pods within school campuses reduce risk. Combined with a mask mandate that has been clearly recommended by the American Academy of Pediatrics, the CDC and a whole host of other medical and scientific bodies, these measures not only protect our children, but protect others in the community from transmission of the virus.
6/ We have a very narrow window of opportunity to enact aggressive public health measures if we are to avoid what is shaping up to be the worst hospitalization surge yet in the state of Texas. It would not be unreasonable to at least anticipate the *possibility* that schools may be forced to delay the start of school or temporarily go virtual for the first several weeks of the year like last year. Case trends and hospitalization trends with a more contagious variant do not bode well for the rest of August. What we are seeing in other states where school has already started the numbers of infected in those jurisdictions presents a precautionary tale for us here in Texas.
PARTING THOUGHTS
I am honestly beside myself and so are many of the physician parents of my school district and those in other school districts were mask mandates have been banned by executive order by state leadership. Fear, anger, and frustration that after 500+ days of this pandemic we are still having to advocate for the effectiveness of vaccinations and mask us is demoralizing. I see not shortage of toxicity and dismissiveness directed at the medical profession now when it comes to discussing protecting kids from the Delta variant.
My ten year old has a more functional sense of morality and community than most adults these days.
That's messed up.
PAST PANDEMIC POSTS (FACEBOOK LINKS)
COVID TRENDS: TEXAS (03 August 2021):
https://www.facebook.com/jp.j.santiago/posts/10219275998347691
NEW VARIANT OF CONCERN: AY.3 (DELTA SUBVARIANT) (22 July 2021): https://www.facebook.com/jp.j.santiago/posts/10219219371852064
HE SAID WHAT? A WARNING FOR THE UNITED STATES (12 July 2021): https://www.facebook.com/1141591254/posts/10219175207947994
WHERE IS THE DELTA VARIANT SURGING? (11 July 2021):
https://www.facebook.com/1141591254/posts/10219170740476310
COVID VARIANTS TABLE UPDATE (30 June 2021):
https://www.facebook.com/jp.j.santiago/posts/10219119070944604
MAYO CLINIC GRAND ROUNDS: VACCINES AND VARIANTS (14 June 2021):
https://www.facebook.com/jp.j.santiago/posts/10219031846404045
THE MOLECULAR BIOLOGY OF THE E484K MUTATION (10 May 2021):
https://www.facebook.com/jp.j.santiago/posts/10218832046529173
IMMUNOLOGY 101: THE IMMUNE SYSTEM- REPOST/UPDATE (05 May 2021):
https://www.facebook.com/jp.j.santiago/posts/10218801066954703
COVID VARIANTS OVERVIEW AND UPDATE (22 April 2021):
https://www.facebook.com/jp.j.santiago/posts/10218722676514991
NEW COVID VARIANT OF INTEREST: B.1.617 (18 April 2021):
https://www.facebook.com/jp.j.santiago/posts/10218699298170547
CASE SURGES CAN RESULT IN COVID VARIANTS (12 April 2021):
https://www.facebook.com/jp.j.santiago/posts/10218657527966318
THE OVERVIEW & STATUS OF COVID VARIANTS (9 April 2021):
https://www.facebook.com/jp.j.santiago/posts/10218637120816152
QUICK UPDATE: THE COVID FAMILY TREE (01 February 2021):
https://www.facebook.com/jp.j.santiago/posts/10218211054244754
COVID MUTANTS: VARIANTS OF CONCERN (31 January 2021):
https://www.facebook.com/jp.j.santiago/posts/10218204381877949
COVID MOLECULAR BIOLOGY: THE SPIKE (6 January 2021):
https://www.facebook.com/jp.j.santiago/posts/10218019683340601